


Back in August we reported that the high court of New Zealand was asked to invalidate the weather service’s (NIWA’s) manipulated temperature record. In the story, it was reported:
The New Zealand Met Service record shows no warming during the last century, but NIWA has adopted a series of invariably downward adjustments in the period prior to World War 2. Because these move the old temperature records downwards, the 7SS NZTR shows a huge bounce-back of over 1C in the first half of the century” said Mr Leyland. “Although this is out of line with dozens of other records, and has been the subject of sustained questioning by both the New Zealand Climate Science Coalition and the ACT party, NIWA refuses to accept that there are serious problems with the adjustments. In fact, no one has been able to explain exactly how they were arrived at.”
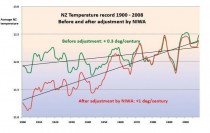
Enlarged here.
In this new story, NIWA has capitulated, stating they were not responsible for the national temperature record (NZTR).
By Richard Treadgold
Three weeks ago NIWA released their Statement of Defence in response to the NZ Climate Science Coalition’s Statement of Claim regarding an Application for a Judicial Review. You have to be a lawyer (which I’m not) to see the ramifications and it’s taking a while to work through it, but these are my first reactions and I can’t hold them back any longer.
Most of this will upset NIWA’s supporters. If you’re a NIWA supporter, go find a buddy to hug before reading on. This will rock your world.
Because NIWA formally denies all responsibility for the national temperature record (NZTR).
Betrayal of supporters
Now that is surprising - shocking, really. Forget their defensive posturing since our paper criticising it last November - now they’ve given that up and say the NZTR isn’t their problem, they’re not responsible for maintaining it and apparently there’s no such thing as an “official” New Zealand Temperature Record anyway.
Will the MSM pick this up? I think they should, but I rather doubt they will.
If I was a long-term NIWA supporter, I’d be a bit miffed to hear this revelation. I’d think that NIWA had betrayed us. We’d been supporting them for months and months against scurrilous attacks on their reputation, arguing that they had good reasons for doing what they did, then they turn around and say the temperature graph is nothing to do with them!
NZCSC: “It’s faulty.” NIWA: “It’s not ours.”
How can this be the action of earnest, dedicated scientists - their answer to months of implied accusations of dishonest science? Having suffered, according to their supporters, attempts to smear their top scientists, how can NIWA respond by saying they dont want to be held responsible?
They’re not defending the temperature record or the mistakes in it, they’re virtually saying: “You’re right, the dataset could be shonky, so we’re washing our hands of it.” Which gives us no confidence in the “science” they might have applied to it. What the hell’s going on? I actually hope their lawyers know a cunning trick to get them out of this, and it’s not what it seems. Because its my NIWA too!
But it gets worse.
NIWA has formally stated that, in their opinion, they are not required to use the best available information nor to apply the best scientific practices and techniques available at any given time. They don’t think that forms any part of their statutory obligation to pursue “excellence”.
And that little bombshell just does my head in. For how can they pursue excellence without using the best techniques?
NIWA denies there is any such thing as an “official” NZ Temperature Record, although they’re happy to create an acronym for it (NZTR). The famous “Seven-station series” (7SS) is completely unofficial and strictly for internal research purposes. Nobody else should rely on it.
It certainly looks like the NZ temperature record
So it doesn’t exist except as an acronym - and in the laboratory - and they aren’t obliged to look after it.
Wow (WOW).
If the 7SS - posted on their web site on a page headed “NZ temperature record” and looking for all the world like an official NZ temperature record - was unimpeachably correct, NIWA would be happy to claim it and to tenderly look after it. The only reason to wash their hands of it is because it’s crippled with faults - fatally flawed - just as we’ve been saying.
We were right all along.
Wow.
But if the 7SS is a dead duck, what will NIWA say in future if the Government or the Courts ask whether New Zealand has warmed or cooled over the last 100 years? Well, they are getting a new NZTR, and they expect the replacement one to be a bit more defensible. We’ll have to wait and see what it concludes about cooling or warming.
$70,000 to fix and we found it for nothing
Back in February, when the NZ Climate Science Coalition wrote to Chris Mace, the chairman of NIWA, pointing out a mass of shonky aspects of the 7SS, Mr Mace promised that it would be formally “reviewed”. Minister Wayne Mapp later told Parliament that the “review” would involve five or six scientists working for about six months on justifying the NIWA adjustments. He also said that NIWA was getting an additional vote of $70,000 in the 2010 budget to cover the expenses of the “review”.
That’s a lot of time and resources to fix a problem we quickly unearthed without funding.
It’s all quite a compliment to Jim Salinger, too. After all, he made up the 7SS adjustments when he was a student back in the 1970s - with no taxpayer grants nor team of scientists to help. In 1992, 20 years later, NIWA didn’t even check Jim’s calculations (lost in a computer schemozzle) or update the methodology before adopting the whole thing as a NIWA taonga.
They seem to be doing their homework this time. Their statement of defence discloses that the new NZTR is all ready to go, subject only to peer review by the Australian Bureau of Meteorology (BOM). Before too long the 7SS will be history.
Victory without firing a shot! It’s great to be vindicated after the criticism we’ve copped, but what an anti-climax!
After the country has a well-founded temperature record, I wonder if anyone will remember to thank us? Read more here.
By Lubos Motl, The Reference Frame
It’s a Nobel prize week, so I will deliberately insert the inventor’s name to many postings.
The BBC has interviewed “Nobel winner Richard Lindzen on being a climate change denier, and why office plants rock” (it’s their description!):
Our Planet (audio)
At the very beginning, Lindzen corrects the host that he is no “skeptic”: a “denier” (or “realist") is actually more accurate. Lindzen’s impressive list of publications is mentioned, among many other things. It’s the kind of a BBC program that would be unthinkable just a year ago.
Something has obviously changed about the forces that determine what is thinkable and what is unthinkable at BBC - and elsewhere. Don’t get me wrong: the previously unthinkable program was still hosted by the same kind of an unthinking host who would present the thinkable programs for the unthinking audiences years ago, too. ![]()
Hat tip: Willie Soon
The BBC program recalls some history of the car industry and the theory of the greenhouse effect. Richard’s publications, jobs, and awards are mentioned. Dick explains that the word “skeptic” is misleading because the word assumes that there is some pre-existing case for something that could be believed in, and the skeptics don’t believe it. However, there is no case for a climate threat.
Needless to say, the host gets a bit combative and mentions that there are “tens of thousands” of scientists who predict a climate threat. (I am not sure where he got this particular meaningless number from.) Many of them even possess a box with a red button, he tells Richard in between the lines, but please feel no pressure. ![]()
Dick answers that a few years ago, no sane person would say such a silly thing as that there were tens of thousands of people who predict a climate threat. It’s a small, small field. The host says that there are many of them now. Dick explains that they grew out of the emotions and most of them are not climate scientists and have no understanding of the atmospheric dynamics. Many of them study cockroaches and their friends and they have added the “impact of AGW” to their research, Richard explains to the stunned host who clearly has no idea about the real world.
The BBC play some statements by a high-positioned nutcase who states that AGW is the most carefully studied piece of science - ever. Lindzen says that it’s nonsense and the person has a vested interest to say such things. (Can you imagine: the most studied pieces of science? AGW is among the most vague, uncertain, and skewed by systematic errors portions of science ever published.) The host - who was clearly asked by a boss to record the first sensible program about the climate in his life - becomes emotional and asks Why would Lindzen “believe” that it is biased. Well, Lindzen actually knows it - rather than believes it - because he has participated in this process. He gives an example (but it may have been cut).
(A meaningless mixture of weather and biodiesel in Kuala Lumpur, Malaysia follows. A new frog species is found in Borneo, too. When the original host returns, they argue whether houseplants are good or not. The arguments in both directions looked very superficial to me. These people offering their superstitions about houseplants are the typical representatives of those tens of thousands of people who are supposed to beat Lindzen.)
At 21:30, they return to Lindzen. A convoluted question leads Lindzen to explain that the precautionary principle is just an absurd formula for selective stasis. They discuss what you should do if a majority recommends you that you should insure your house against something. Richard gives an example where it would be preposterous to insure the house. The host agrees. But of course, he doesn’t want to agree with the big picture.
Dick laughs when the host respectfully mentions the name of a crackpot, Nicholas Stern. Lindzen explains that Stern’s report is wrong at pretty much every level. He says that the carbon markets will swallow tens of trillions of dollars and it will be pointless. However, for the large banks, it will be nice. A listener asks where Richard’s funding comes from. The answer is that it was always the U.S. government, of course: DOE, NASA, NSF, and so on.
The host is able to figure out that the question comes with the “implication” that Richard is paid by the evil oil industry. How did he find the implication in the question? It’s clearly not included in the question. However, the host is obviously right because he could have guessed that the listener was as brainwashed by the environmentalist smear campaigns addressed to morons as the host himself. Richard, who mentions that some people also say that he is funded by the tobacco industry, says that the only money from the oil industry he has ever received was a lecture fee he shared with 3 environmentalists.
Another question is what would convince Lindzen that “it” is real. Lindzen says he already knows “it” is real - it is just small and unable to grow to anything that matters, relatively to the normal sources of local variability. The third question was rephrased into a polite language: it asked whether Lindzen worries that he is letting down (or scr*wing or worse) future generations. Lindzen can’t worry because the proposed policies are “pain without gain” even if you believe in catastrophic warming. However, there’s also overwhelming evidence that the sensitivity is much lower than the figure declared by the institutions.
Nice talking to you.
See post here.
By Joseph D’Aleo
See also SPPI’s Extreme Weather - The Blame Game by Dennis Ambler here. See more on extremes in this Steve Goddard post on WUWT here.
We have had some extreme conditions the last few years - of cold, heat, snow and rain. Detailed summaries on the cold last winter can be found here and on the hot summer here and here. Both were memorable seasons indeed. Though the second author did an excellent job detailing the summer records and did mention the amplified and frozen jet stream, he went on to say man made global warming contributed to it.
Whereas the media and alarmists like to portray extremes (Holdren has called it “Climate Disruption") as the result of or greatly amplified by man made greenhouse gases, natural factors can be shown as the cause (with some contribution from urban warming and bad data). Too many scientists and media ‘enviro’ bloggers have stated “it must be man-made - what else could it be?”.
In short, the last few years, a combination of low solar, high latitude volcanism and record high latitude blocking, and strong ENSO events (both La Nina and El Nino) are acting to increase PERSISTENCE within seasons, which leads to larger seasonal extremes and greater local extremes within seasons. For this post, we will focus on temperatures last winter and this summer and touch on a few causes.
THE ROLE OF THE SUN
The sun is the major driver for climate. The variations in the sun including irradiance, ultraviolet warming through ozone chemistry, galactic cosmic ray diffusion through the solar wind cause variations in the earths atmospheric and surface temperatures, changes in the jet stream and affect the tendency for blocking events. The sun is a factor probably through its effect on blocking also in how persistent patterns are which leads to anomalies to build for the seasons. The directional anomalies vary year to year with other factors such as ENSO and the state of the ocean multidecadal cycles - PDO and AMO.
As New Scientist magazine recently reported “Mike Lockwood at the University of Reading, and Joanna Haigh of Imperial College London have found that although the sun’s brightness does not change much during solar maxima and minima, the type of radiation it emits does. During maxima the sun emits more ultraviolet radiation, which is absorbed by the stratosphere. This warms up, generating high-altitude winds...a stronger jet stream. The reverse is true in solar minima, and the effect is particularly evident in Europe, where minima increase the chances of extreme weather. Indeed, this year’s cold winter and the Russian heat wave in July have been linked to the sun’s current lull, which froze weather systems in place for longer than normal.”
Indeed Baldwin and Dunkerton (2004) showed though solar irradiance varies only 0.1% over the 11 year cycle, radiation at longer UV wavelengths are known to increase by 6 to 8 percent with still larger changes (factor of two or more) at extremely short UV and X-ray wavelengths. Labitzke has shown statistically significant differences of temperatures in the lower stratosphere into the middle troposphere with the 11 year solar cycle (warmest at max). Shindell (1999) showed results from a global climate model including ozone and UV found UV induced stratospheric ozone changes and generated heat that penetrates into the troposphere, in effect confirming Labitzke’s findings.
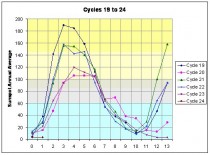
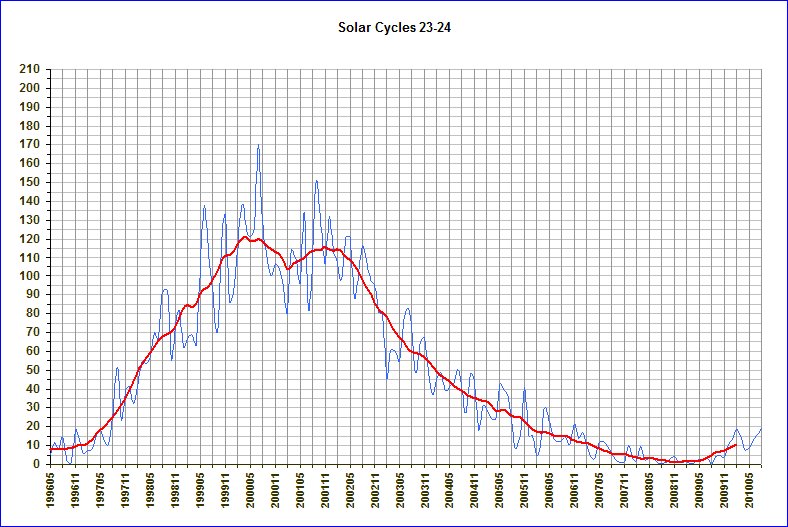
The winters and summers have been very “locked in” the last few years as the sun has been quieter, longer than anytime in at least 100 and very possibly 200 or more years (below, enlarged here).
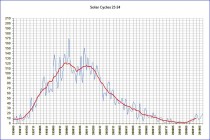
The bottom of cycle 23 was reached in December 2008 and this month may be the first month was a sunspot number of 20 in cycle 24. Compare that to recent cycles - cycle 19 21 months after the minimum reached a monthly number of 124, cycle 20 had touched 57, cycle 21 had reached 94, cycle 22 had climbed to 113, cycle 22 to 55 (below, enlarged here).
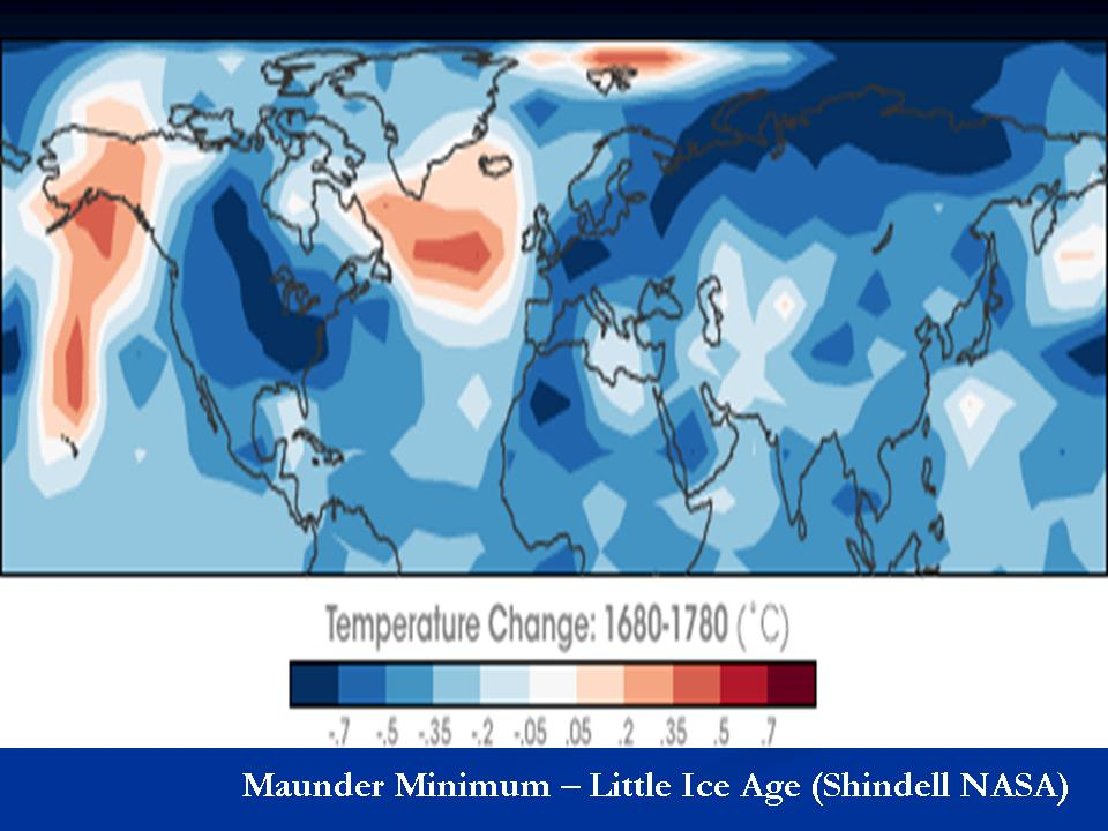
This has led numerous solar scientists to project that this could be the start of a Dalton or even Maunder Minimum. Drew Shindell of NASA GISS, a programmer for James Hansen showed in a paper in 1999 how the increased ultraviolet in active solar years causes warming of the highest atmosphere through ozone chemistry. He then included the chemistry and ultraviolet radiation variations in a climate model. He showed he had better results depicting the variance over the various cycles at maxima and minima. He also showed in a NASA Earth observatory how this factor could have explained the Little Ice Age of the Maunder Minimum.
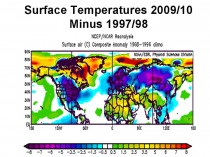
Their model showed when the sun was quiet in 1680, it was much colder than when it became active again one hundred years later. “During this period, very few sunspots appeared on the surface of the Sun, and the overall brightness of the Sun decreased slightly. Already in the midst of a colder-than-average period called the Little Ice Age, Europe and North America went into a deep freeze: alpine glaciers extended over valley farmland; sea ice crept south from the Arctic; and the famous canals in the Netherlands froze regularly - an event that is rare today.” (below, enlarged here).

This chart shows the model derived difference between 1680 in the heart of the Maunder Minimum and 1780, when the sun had become active again.
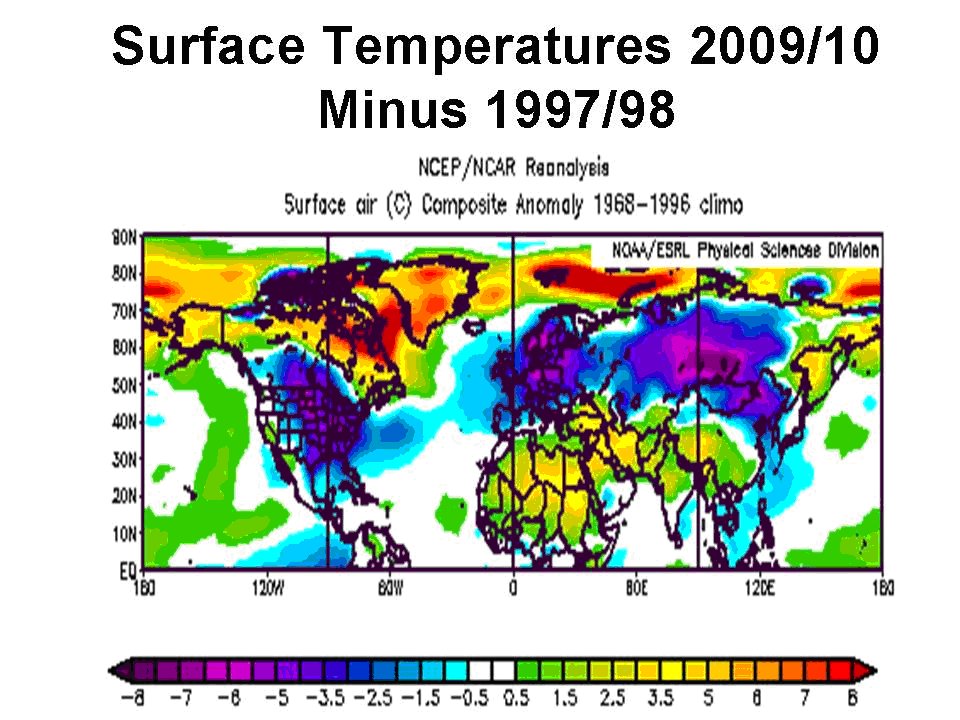
I did a similar winter hemispheric temperature difference between the two strongest El Ninos of the last dozen years 2009/10 and 1997/98. It yielded similar results. You can see how much more “Maunder-like” this El Nino was compared to the one in 1997/98! (below, enlarged here). (more on winter in the full PDF).
SUMMER 2010
Summer 2010 was again characterized by vey stable and amplified pattern which led to strong anomalies and extremes. La Nina came on strongly after a strong El Nino winter. When that has happened in the past usually it meant a hot summer - recent examples include 1966, 1988, 1995, 1999. Madhav Khandekar has shown here how the Pakistan floods are not uncommon and historically have occurred in years when a La Nina summer came on after an El Nino winter. This time remember the sun is struggling to emerge from a long slumber. Blocking continued this summer though the strongest mid-latitude ridging set up over eastern Europe/western Russia and the eastern United States and troughing in a chilly west coast of North America and a very wet Pakistan and India.
GLOBAL HEAT RECORDS AND PAST SOLAR ACTIVITY
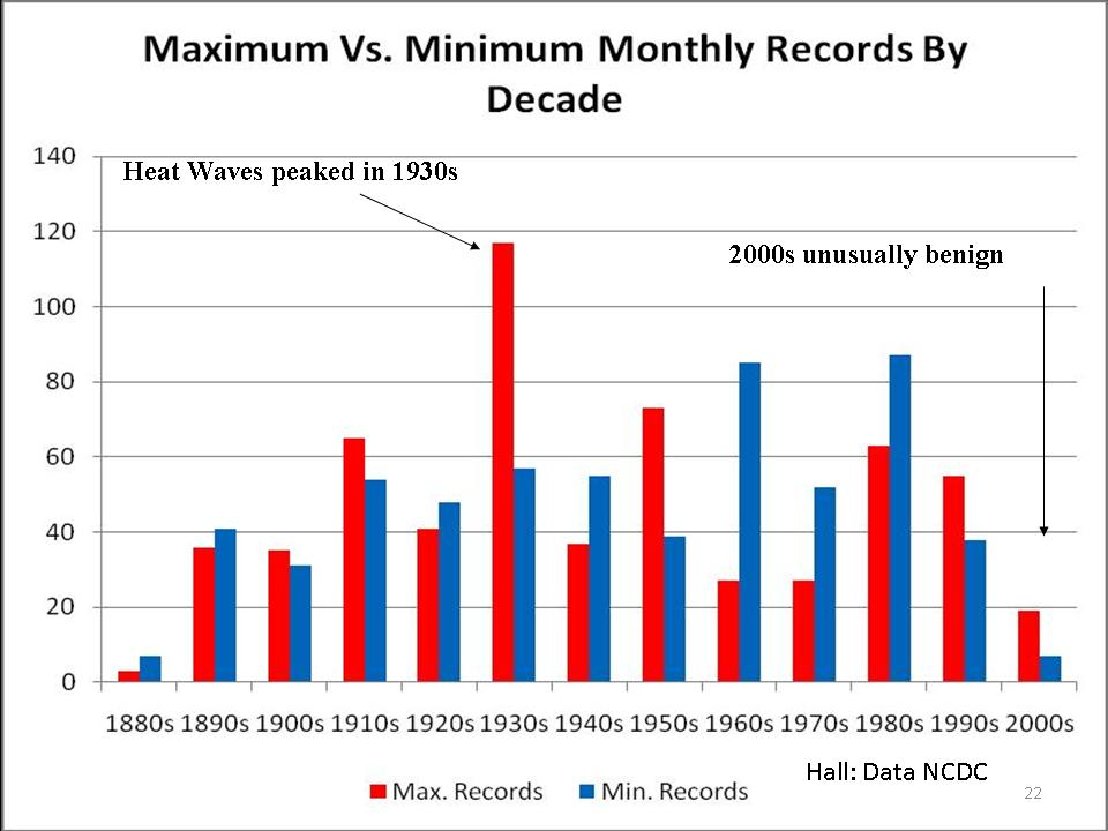
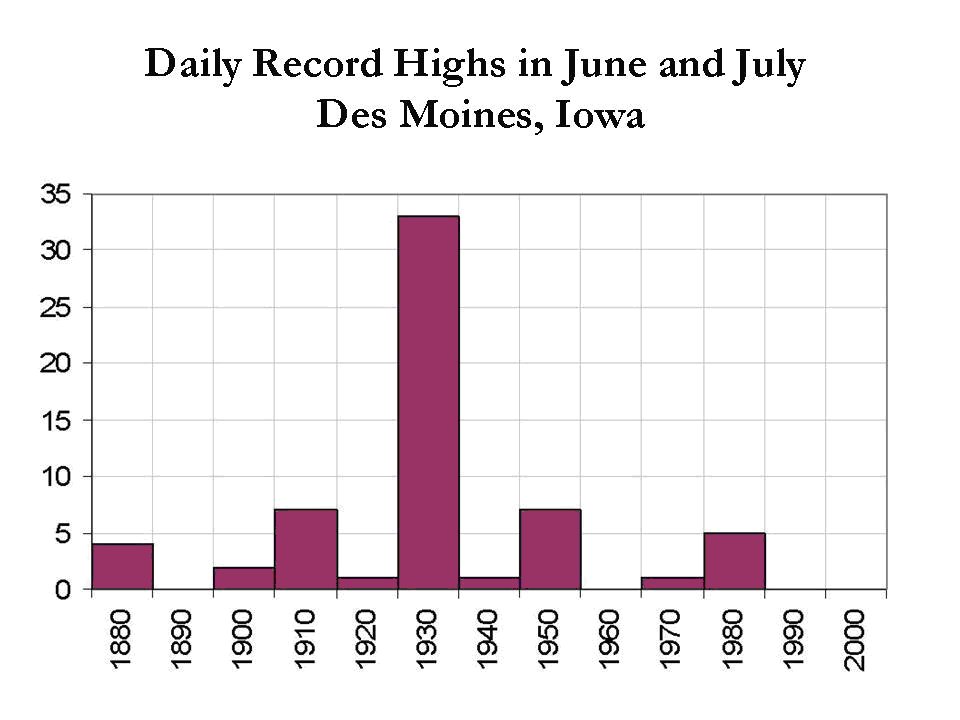
Let’s look at all-time heat records relative to past solar cycles for the continents. We see that they were all in the 1880s and early 1900s. Most were at very low solar monthly sunspot numbers (average of 19 relative to long term average of 55 and peak of over 250). The North American and Oceanic (Philippines) both occurred in the sunspotless years in 1912/1913 most similar to 2008 and 2009. So it appears not only is a quiet sun a time when cold extremes occur but also warm extremes.
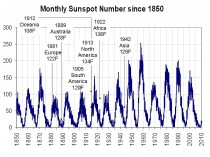
Monthly sunspot number and the continental all-time record high temperatures (enlarged here).
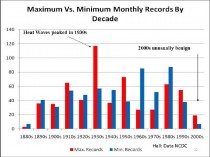
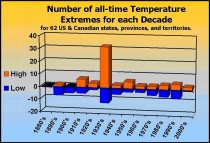
Most of the state records in the United States and Provincial records in Canada came at the end of the quiet sun period in the 1930s (below, enlarged here and here).
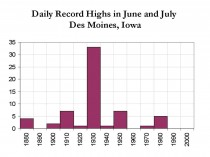
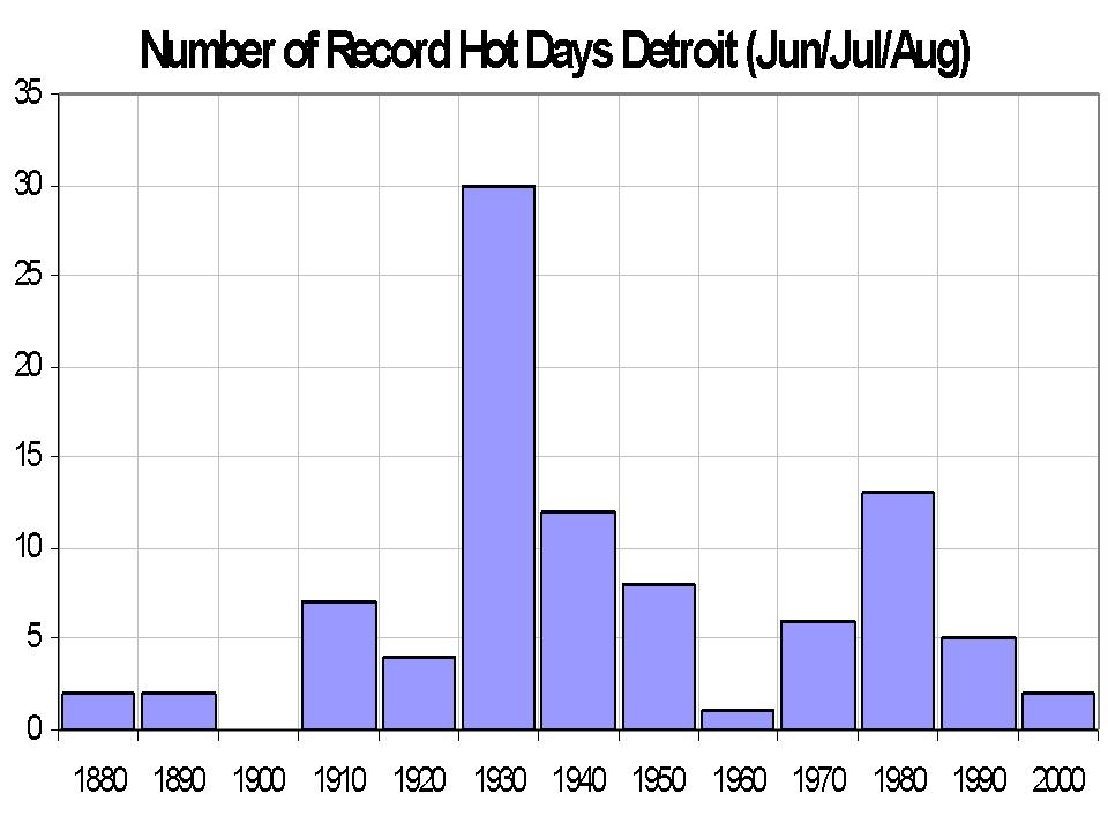
You can see another run off after the min solar slump to the 1960s and 1970s (cycle 20) gave way to strong cycle 21. That is visible in the city records (below, enlarged here and here).

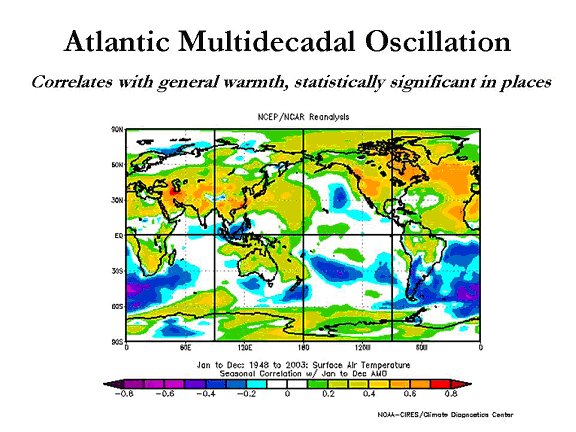
PDO and AMO
I have shown here and in a paper with Dr. Easterbrook here how the PDO and AMO relate to the temperatures in the United States
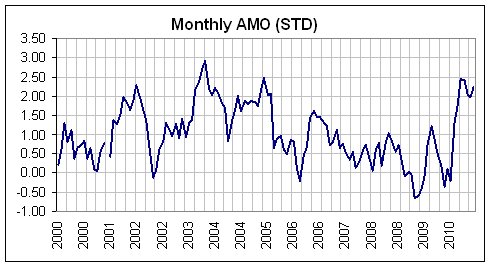
Though the PDO has turned negative (suggesting more La Ninas and a cooling period ahead), the AMO which had peaked in 2004 and 2005 and dropped to slightly negative a couple of years ago jumped to high positive levels this year. This was in part due to lack of tropical activity in the El Nino summer of 2009 which left the tropical Atlantic warmer than normal (hurricane activity serves to remove heat from the tropics and move it to the higher latitudes).
This last winter the suppression of the jet stream well south of normal by the high latitude blocking led to weaker winds and fewer clouds over the subtropics, allowing the warmth to build further. In high latitudes, blocking high pressure replaced normal North Atlantic storms which stir up the water. This has allowed the waters there too to be warmer than normal (below, enlarged here).
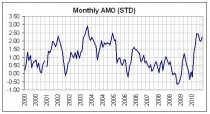
The active tropical season this year is removing ocean heat this year and as they track to the north increase the mixing there. AMO should drop in upcoming months. A positive AMO correlates with warm hemispheric temperatures, a negative with cold (below, enlarged here).

See an excellent AMO analysis here.
See PDF on this post here.
By Dr. Madhav Khandekar
Among the extreme weather events of summer 2010, the extensive floods in Pakistan and their widespread impacts garnered maximum attention in the media as well as in the scientific community. Several climate scientists expressed concern about such weather extremes becoming more common with future climate change, while the WMO (World Meteorological Organization) issued a statement that the weather related cataclysms of July and August (2010) fit patterns predicted by climate scientists. The extensive damage due to floods and plight of thousands of people marooned over waterlogged areas were graphically covered in heart-wrenching details by most newspapers and TV news stories in Canada. Per latest estimates, the floods have claimed over 1500 human fatalities so far and over two million more have been rendered homeless.
From a personal perspective, the TV footage of women & children in knee-deep water brought back poignant memories of a similar situation I witnessed in Pune, my former home-town (a city 200 km southeast of Mumbai, the largest Indian city on the west coast) in July 1961 when incessant monsoon rains in the first week of July 1961 led to the breaking of a dam resulting in massive flooding of the city, destroying hundreds of homes and drowning dozens of people living along the riverside. Several other cities and regions suffered from similar flooding during the 1961 summer monsoon. As it turned out, the 1961 summer monsoon over India and vicinity was the rainiest monsoon season in the 150-year instrument data which caused extensive flooding and loss of life and property in many regions of the country (India Meteorological Department 1962). This year’s monsoon has been quite vigorous since the third week of July 2010 and heavy rains have caused flooding in the peninsular regions of India and also in the northwest regions bordering with Pakistan. Has the vigorous Indian monsoon of 2010 led to the historic floods in Pakistan? Let us briefly consider the monsoon climatology.
Floods & droughts in the Indian monsoon
It should be noted first that the monsoon season in Pakistan is almost in tandem with the Indian monsoon, which is primarily driven by regional as well as global scale features like the ENSO (El Nino-Southern Oscillation) phase, Eurasian snow cover during the (previous) winter season and the QBO (Quasi-Biennial Oscillation) phase of the equatorial stratospheric wind oscillation (see e.g., Khandekar 1996). The monsoon season in Pakistan is generally of a shorter duration, from about 1st of July till about third week of September. Pakistan as a whole receives just about 50 cm (~ 20 inches) monsoon rains,
compared to about 85 cm for the whole of India during the June-September season. Based on an excellent dataset of close to 150 years, some of the most severe floods and droughts in the Indian monsoon have been identified as shown in Figure 1. This figure shows how the floods and droughts have occurred irregularly throughout the 150-yr period and do not appear to reveal any increasing/decreasing trend. As mentioned earlier, the 1961 summer monsoon was the rainiest with extensive flooding while the year 1877 witnessed the most severe drought with over 40% deficit in total seasonal rains.
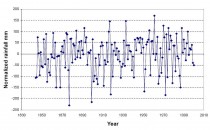
Figure1: Variability in the Indian summer monsoon rainfall, 1844-2000, with seven major droughts (1868, 1877, 1899, 1918, 1951, 1972 and 1987) and six major floods (1892, 1917, 1933, 1961, 1970 and 1975) as shown.
Among other droughts and floods, the monsoon rains were exceptionally heavy in 1917 with extensive floods over many areas of the country, while 1972 was a major drought year resulting in sharply reduced grain yields. The decade of the 1930s experienced in general surplus rains over most of India with three flood years, namely 1933, 1936 and 1938 (Bhalme & Mooley 1980). It is of interest to note that the 1930s were part of the dust bowl years on the Canadian/US Prairies. A possible teleconnective link between Indian monsoon flood and Canadian Prairie drought has been speculated by Khandekar (2004).
Besides these floods and droughts occurring irregularly, the inter-annual variability of monsoon shown in Figure 1 reveals several consecutive years with a flood following a drought. For example, the years 1941, 1972 and 1987 were drought years, while the following years 1942, 1973 and 1988 were flood years. Such a flood-drought sequence seems to suggest a biennial mechanism for the Indian monsoon driven by large-scale atmosphere-ocean circulation patterns and has been analyzed by Terray (1987) among others. The primary mechanism driving such back-to-back flood & drought monsoon seems to be the ENSO phase and its evolution from an El Nino (warm) event to a La Nina (cold) event. The years 1941, 1972 and 1987 were El Nino years, while the succeeding years 1942, 1973 and 1988 were La Nina years. An El Nino event helps suppress convective activity over the Bay of Bengal region (Francis & Gadgil 2009) where from moisture is transported towards the northern Gangetic Plains region and further into northwest India along the Axis of Monsoon Trough which by July is established in a southeast-northwest track from the Bay of Bengal to the northwest region of India bordering Pakistan. (see Figure 2). A few monsoon depressions in the Bay of Bengal help transport moisture in the northwest regions of India and occasionally into Pakistan during the active period of the monsoon season, approximately from early July through mid-August.
Possible cause of flood in Pakistan & northwest India during 2010
The El Nino event of 2009, which produced one of the warmest winters in Canada, was coming to an end by spring 2010. By June 2010, a La Nina (cold phase of ENSO) was developing in the equatorial Pacific, which became intensified by early July. In response to this developing La Nina, the convection over the Bay of Bengal was enhanced and several monsoon depressions helped steer the monsoonal flow into the northwest parts of the Indian subcontinent. During the third week of July 2010, a persistent low pressure over the State of Rajasthan in the northwest part of India helped steer additional moisture into northwest Pakistan resulting in heavy rain events and subsequent flooding. Similar flooding occurred in the Indian States of Rajasthan, Punjab and Kashmir which are adjacent to Pakistan. Per latest statistics (as of August 25 2010), from the India Meteorological Department, the
seasonal rainfall over the northwestern Indian States has already exceeded 125% of the normal.
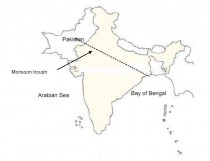
Figure 2: Outline map of India and Pakistan showing normal July position of monsoon trough axis.
It is worth noting that in a given monsoon season, localized and/or regional flooding can occur in some parts of the Indian subcontinent, while some other parts may be suffering from rain deficit at the same time. Such surplus/deficit rain patterns are an integral part of the monsoon season which rarely ever produces evenly distributed rainfall in a season. During the rainiest monsoon season of 1961, central India received about 30% more rain than normal, while the northeast region (where the world’s wettest spot Cherrapunjee is located) the seasonal rains were in deficit by 25%.
Concluding Remarks
A rapid transition of the ENSO phase from El Nino to La Nina between spring and summer of 2010 appears to be the key element in triggering a vigorous monsoon of 2010 over the Indian subcontinent. The La Nina phase was responsible for enhanced convective activity over the Bay of Bengal where several monsoon depressions were formed. The depressions while traveling along the axis of monsoon trough carried sufficient moisture towards northwest leading to extensive flooding. Local and regional factors like topography may have exacerbated the impact of floods in some areas. An examination of monsoon climatology as revealed by Figure 1 suggests that the 2010 Pakistan floods, although seemingly unprecedented, were well within natural variability of monsoonal climate over the Indian subcontinent. As I have suggested before (Khandekar 2009), there is an urgent need for an improved understanding of many complex features associated with the Indian/Asian monsoon system. An improved understanding may enable us to improve monsoon predictability, thereby minimizing adverse future impacts of such floods and droughts. See more here.
Sea Level Falling In 2010?By Steven Goddard
We are constantly being told that 2010 is the hottest year ever, and that the polar ice caps are melting down at a record rate. Dr. Hansen tells us to expect 3-6+ metres of sea level rise this century. That would be a minimum of 30 mm/year.

Low tide in Brittany
Given Dr. Hansen’s record heat, the oceans must be heating and expanding, and the polar ice sheets must be melting and pouring into the sea. Sea level must be rising like crazy!
Hansen’s completely bogus graph shows Greenland blowing away their previous record high annual temperature. They must be having a flood of melting ice up there.
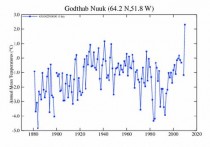
Someone at GISS appears to have a sense of humour. The graph above (enlarged here) shows annual average temperatures (not anomalies) for the capital of Greenland. It looks like 2010 is by far the warmest year on record.
Most people displaying this type of information would be sensible enough to wait until the end of the year to calculate an annual mean. Obviously the January-August mean temperature is going to be much higher than the January-December mean. The 2010 data point should not appear on the graph until 2010 is over.
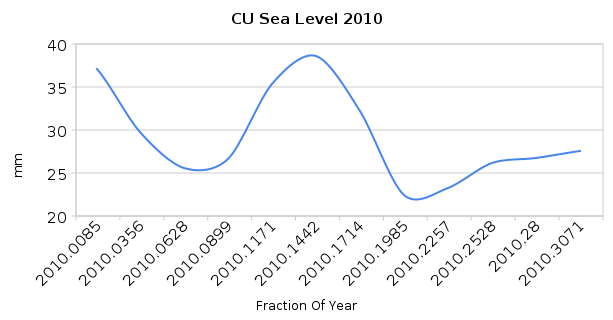
Only problem is, since the start of the hottest year ever, sea level has fallen 10 mm. The most recent data from The University Of Colorado is shown below (enlarged here).
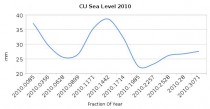
We can conclude that the oceans are neither heating nor are the polar ice caps melting at a rapid rate. As usual, Hansen’s theory does not match observations on the ground.
Hansen is so last millenium. He already used up all of his best temperature adjustments and is running out of time to get some real warming going.
See posts here.
ICECAP NOTE: We should expect a rise this year in Greenland temperature with the record negative Arctic Oscillation. We also note that the sea level data is through a third of the year. There are often more than one peak in a year and the big one is often the second half.

(sea levels every 10 days - mm)
Note also there has been some pop up since 2009 as the oceans warmed with El Nino. A good part of sea level rise in warmer years is thermal expansion. Note the leveling off during the La Nina of 2007-2009 when the oceans cooled and contracted. For the same reason that Hansen should not be reporting on 2010 with less than 2/3rds of the data, we can’t yet make a call about 2010 sea level until it is over. I am sure Steve will update us then.
David R. Legates, Ph.D., C.C.M
Introduction
On Wednesday, August 25, I was invited by Environment America to speak at its September 8 press conference on “Extreme Weather in Delaware”, to promote the release of their new report on the subject at Legislative Hall. Ms. Hannah Leone was pleased to have me speak because my “knowledge on climate change and weather would be a great asset to the event.”
On Friday, August 27, I was uninvited from the event by Ms. Leone, who noted that “I believe it is in the best interest of the success of our report that you do not participation [sic] in this event” but “as lead climatologist in the state, your opinion would be beneficial to us.” She had earlier indicated to me in a telephone call that she wanted to make sure everyone was on the same page at the event.
I believe that it is in the best interest of the citizens of Delaware that my “knowledge on climate change and weather” is made public, in light of the biases that are potentially inherent in the Environment America report. I say ‘potentially inherent’ because, although I was promised a copy of the report, even after I was uninvited, I have yet to receive it. However, Ms. Leone was kind enough to indicate the premise of the report in her first e-mail to me:
On September 8th we will be holding a press conference around our new Environment America Extreme Weather Report that examines the science linking global warming with hurricanes and tropical storms; coastal storms and sea level rise; flooding and extreme rainfall; snowstorms; and drought, wildfire and heat waves. The report includes snapshot case studies of these extreme weather events that have occurred in the U.S. since 2005, and the damage that they caused, including a case study in Delaware. We do not suggest that these extreme weather events were caused by global warming. Rather, the point of examining the recent extreme weather events - and the economic losses and other negative impacts they caused - is to document why we need to take action to protect against them, including by reducing emissions of pollutants that are changing our climate.
The contradictions and biases evidenced by my communications with Environment America are fascinating. Although they willingly admit that “we do not suggest that these extreme weather events were caused by global warming,” they are willing to assert that: (1) average planetary temperatures continue to increase; (2) the frequency and/or intensity of these events are increasing; and (3) reducing ‘climate changing’ CO2 emissions will protect against these events. I will argue that none of these assertions is true.
Conclusions
As a Delaware Native who has lived in this State for almost forty years, I care very much about the Diamond State and its ecology. I too am concerned that we act as good stewards of our environment. As a scientist, I have spent my entire professional career studying weather and climate and trying to understand climate change processes. I am therefore outraged when I see outright misstatements of fact being used for political gain. My concern is that there has been no significant increase in extreme weather - just an increase in its coverage with a more global media and an increase in its hype due to the political ramifications that climate change can have.
Environment America’s claim that the alleged increase in extreme weather events can be alleviated by taking action to reduce emissions of carbon dioxide is unfounded. These events have not been increasing in either frequency or intensity and they are clearly not linked to increasing concentrations of carbon dioxide. Limiting carbon dioxide emissions will have no effect at all on the frequency or intensity of these events. Unfortunately the negative ramifications of attempting to limit such emissions will be far too real. Our best solution is to make the public more aware of these dangers, provide more timely detection and dissemination of potential extreme weather hazards (in which the National Weather Service and several State agencies have been actively engaged), and encourage people to stop building in hazardous locations, thereby putting the existing population more at risk.
See detailed analysis of all the weather threats claimed by Environment America and other environmental groups, psuedoscientists and mainstream media alarmists here.
It is clear these groups and their media messengers are uninterested in facts or the truth just in communicating the scare message that they think will bring their movement to success. This is just another example of the blatant hypocracy that the public must be made aware of.

By Mackenzie Carpenter, Pittsburgh Post-Gazette
STATE COLLEGE—Summer is just so yesterday.
Or is it?
Today may be the first day of autumn, but Joe Bastardi, the exuberant, colorful, controversial Accuweather hurricane forecaster—indeed, the only meteorologist probably ever to appear on both Stephen Colbert’s and Bill O’Reilly’s shows—was hunched over three computer screens Tuesday shaking his head.
“I don’t think you’ll need your fall clothing in October, but you’re going to need it in November,” he said, noting that after Wednesday’s late-day storms cooled things off a bit, Friday’s temperatures in Pittsburgh would be 10 to 15 degrees above normal and will remain relatively mild through the end of next month—when it will suddenly get cold.
But what was really consuming Mr. Bastardi’s attention at Accuweather’s headquarters wasn’t the balmy weather system draping itself over the Northeast and Mid-Atlantic for the next six weeks or so, but rather two blobs at the bottom of his screen.
“That’s Lisa, she’s not a worry to us,” he said, pointing to a hurricane in the eastern Atlantic. “And that,” he said, pointing to a fuzzy area near South America, his voice lowering to a whisper, “is not quite alive yet, but it’s going to be Matthew. By this time next week you could have two more going at the same time.”
Lisa and Matthew may either signal the beginning of the end of the hurricane season, which officially started June 1 and ends Nov. 30—or merely the end of the beginning.
Indeed, at State College-based Accuweather, one of the two big for-profit weather services (The Weather Channel, a cable channel with an online site, is the other), that means a big, sexy, if initially somewhat incomprehensible headline—“Get Ready for Troptober”—on a Tuesday afternoon press release.
“AccuWeather.com Hurricane Expert Joe Bastardi remains very concerned that the raging La Nina and its associated cool waters in the tropical Pacific have created a tremendous imbalance” leading to a very tropical October in the southeastern U.S. (Troptober, get it?) and “a barrage of tropical cyclones appearing to form in succession over the Caribbean and the southwestern Atlantic during the last few days of September through the first part in October.”
Which is to say, Katy bar the door, at least if you live anywhere between Louisiana and the Carolinas—and Pittsburghers should pay attention, too, since any storm coming through the Gulf of Mexico could end up as remnants here.
In this busiest of seasons for hurricane forecasters, Mr. Bastardi, who says he got three hours of sleep the night before, has a lot riding on whether this year’s count is correct. In February, he forecast 16 to 18 storms, including what he called 7 “impact events” (i.e. those with winds of 40 miles an hour that impact the U.S., either brushing or hitting the coast directly). In June, he upped that figure to 18 to 21 storms, with eight impact events, four or five of which would be hurricanes. Of those hurricanes, he added, two would be major, with winds of 110 miles an hour or more.
So far, he’s up to five impact events but only one hurricane affecting the U.S.—Earl. It’s still been a year for the history books, though. For the first time in 84 years, two category 4 storms—Igor and Julia—reached that intensity in the Atlantic, on the same day, even if they never did reach the U.S.
Mr. Bastardi, chief hurricane and long range forecaster—and, at 55, a national bodybuilding competitor in his spare time—calls himself “a warrior for the weather.” He hasn’t always been right—after five nearly flawless years in a row, he stumbled a bit in 2007 when he got the total number of hurricanes correct but predicted that Florida would be “a bull’s eye,” when it wasn’t.
But 2008 and 2009 were on target, which is important for Mr. Bastardi’s private clients around the world, mostly energy traders, retailers, agricultural interests, as well as readers of Accuweather.com’s professional and free sites.
This year, the weather patterns are “just like 1964. And 1950,” said Mr. Bastardi, who relies not just on computer modeling but climate history to inform his forecasts, noting that the Atlantic has been in a warm phase since 1995, when the latest active-hurricane era began, and will start entering a cooling down period in about 10 years.
“The greatest thing about Joe is that he loves the weather,” said William Gray, the 80-year old dean of hurricane scientists at Colorado State University, who issues his own forecasts in December and also predicted a busier than usual season.
Which brings us to a slightly sticky subject: Dr. Gray, like Mr. Bastardi, firmly believes that human-generated global warming isn’t happening but is just part of a natural phenomenon of long-term warming and cooling trends.
Both have received considerable flak for this—New Yorker writer Elizabeth Kolbert called Mr. Bastardi’s position “ridiculous” in a column—but Mr. Bastardi loves a good argument, so he appeared on Bill O’Reilly’s Fox News program last year to debate the issue with Bill Nye, “The Science Guy.” Then, in April, he faced off on Comedy Central’s “The Colbert Report” against Brenda Ekwurzel of the Union of Concerned Scientists.
“He’s among a minority of meteorologists, mostly on television, who say these things and who don’t have expertise in what’s happening with our climate from a long-range perspective,” said Aaron Huertas, a spokesman for the Union of Concerned Scientists. “It’s about as valid as a climate scientist criticizing Mr. Bastardi’s annual hurricane predictions.”
Mr. Bastardi is unapologetic and, more than that, regards Dr. Gray as something of a father figure—next to his own father, who was also a meteorologist. After telling Dr. Gray he’d been conceived in October of 1954 during Hurricane Hazel, he says the senior hurricane scientist fixed him with a glare.
“Think Christopher Lloyd, the mad scientist in ‘Back to the Future,’ “ Mr. Bastardi said. “Dr. Gray just looked at me and said, ‘That’s remarkable,’ and went on to say that he’d been in the hurricane forecast center in Washington, D.C., the night Hazel hit, ‘and the forecaster watching the storm had a coronary and died. That means HIS spirit must have entered your body!’ “
Mr. Bastardi laughs at the memory, then turns serious.
“My mother called me in tears once,” he said, after she’d read the comments section of The Huffington Post during the global warming controversy when some poster called him “the meteorological equivalent of Glenn Beck ... while some facets of what he says might be true, Bastardi has a horrific record of crying wolf.”
“I told her, ‘Mom, you shouldn’t read that stuff.’ “
Still, in the Sept. 21 column “Do I even want to be right?” published on Statecollege.com, Mr. Bastardi described how conflicted he’s felt in the past for being right, because “If I’m right, it means misery, pure and simple.” But when “your personality accepts nothing less than winning,” being wrong is painful, too, he said.
Still, he takes comfort from words spoken by his Accuweather boss, Joel Myers, made during one of many impassioned arguments over weather they’d had over the years.
“He said, ‘You know you’re among the best when you start getting judged by your worst day.’ “ See post here. See six prominent climatologists who agree with Joe’s take on climate change here.
-----------
More on Warm Summer in Central and Eastern United States
By Joseph D’Aleo
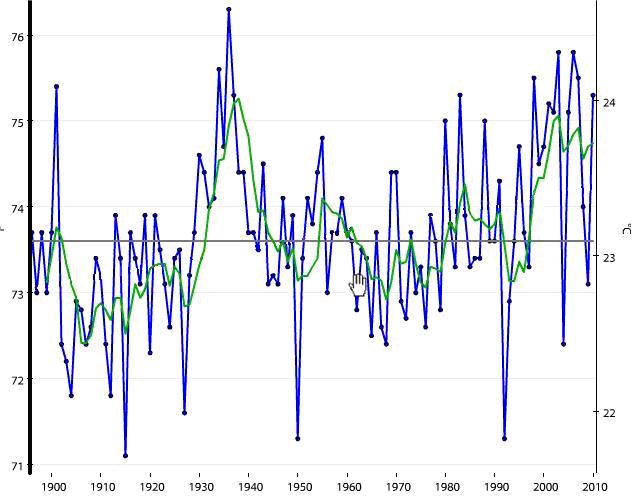
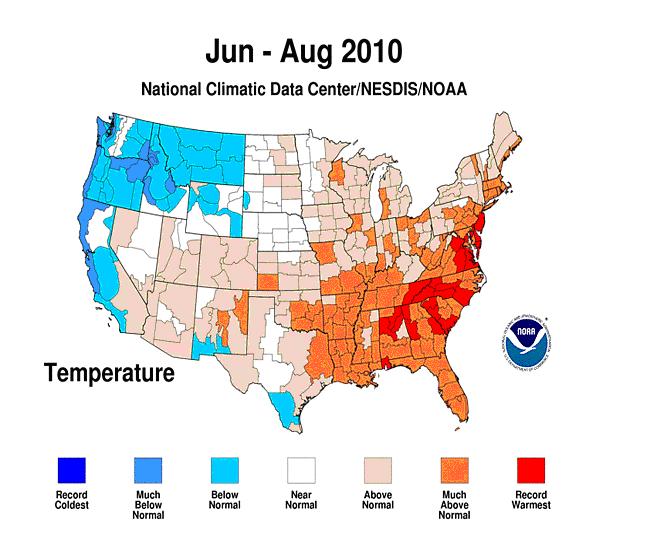
NCDC reported that the summer was the fourth warmest for the United States according to NOAA NCDC. Although the graph of the June through August period from NCDC suggests it was the 9th warmest.

Enlarged here.
Before 2007 in version 1 of USHCN there was an urban adjustment that reduced temperatures in urban areas according to the population. That was removed in 2007 which resulted in a cooling of the temperatures before 1980 and a warming of the recent decades.
However there is no doubt it was a warm summer in the east and central. This was expected as an El Nino winter that gives way to a moderate La Nina summer is typically hot in the central and east (1966, 1988, 1995 and 1999 are some examples). Most forecasters saw this coming. La Nina will mean next summer will be cooler more like 2008 or 2009. (Note: Dr. Madhav Khandekar has shown in this analysis the same rapid transition of El Nino to La Nina leads to heavier monsoon like rains and flooding in India and Pakistan.

Enlarged here.
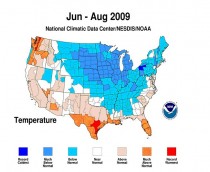
Summer 2009 was 0.5F below normal. Enlarged here.

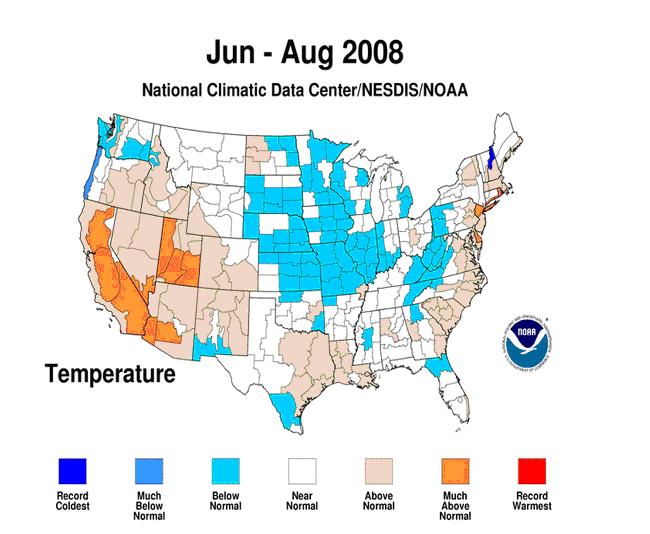
Summer 2008 was 0.4F above for the US as a whole though cold in the central. Enlarged here.
The average for the summer for the United States was 2.2F above normal this year that matched the amount the winter temperatures were BELOW normal this past winter for the United States.

Enlarged here.

This winter will be more like that of 2007/08 or 2008/09. The La Nina will mean next summer will be cooler more like 2008 or 2009. (PDF)
Also note what we showed after last winter in this story by Steve Goddard on WUWT how Rutgers Snow Lab Northern Hemisphere snow cover for the winter has 3 of the top 4 winters this past decade. Steve with tongue frozen in cheek correctly points out: “During the 1960s and 1970s, extensive snow cover was caused by cold temperatures - but since global climate disruption kicked in, snow is now caused by heat. Global climate disruption has apparently changed the fundamental properties of water.”
UPDATE: Listen to a PODCAST that addresses the extreme temperature issues among others. See also many other Podcasts from James Taylor and the Heartland Environmental and Climate News site.
By Joseph D’Aleo
NCDC reported that the summer was the fourth warmest for the United States according to NOAA NCDC. Although the graph of the June through August period from NCDC suggested it was the 9th warmest.
Enlarged here.
Before 2007 in version 1 of USHCN there was an urban adjustment that reduced temperatures in urban areas according to the population. That was removed in 2007 which resulted in a cooling of the temperatures before 1980 and a warming of the recent decades.
However there is no doubt it was a warm summer in the east and central. This was expected as an El Nino winter that gives way to a moderate La Nina summer is typically hot in the central and east (1966, 1988, 1995 and 1999 are some examples). Most forecasters saw this coming. La Nina will mean next summer will be cooler more like 2008 or 2009. (Note: Dr. Madhav Khandekar has shown in this analysis the same rapid transition of El Nino to La Nina leads to heavier monsoon like rains and flooding in India and Pakistan.
Enlarged here.
Summer 2009 was 0.5F below normal. Enlarged here.
Summer 2008 was 0.4F above for the US as a whole though cold in the central. Enlarged here.
The average for the summer for the United States was 2.2F above normal this year that matched the amount the winter temperatures were BELOW normal this past winter for the United States.
Enlarged here.
This winter will be more like that of 2007/08 or 2008/09. The La Nina will mean next summer will be cooler more like 2008 or 2009. (PDF)
Also note what we showed after last winter in this story by Steve Goddard on WUWT how Rutgers Snow Lab Northern Hemisphere snow cover for the winter has 3 of the top 4 winters this past decade. Steve with tongue frozen in cheek correctly points out: “During the 1960s and 1970s, extensive snow cover was caused by cold temperatures - but since global climate disruption kicked in, snow is now caused by heat. Global climate disruption has apparently changed the fundamental properties of water.”
UPDATE: Listen to a PODCAST that addresses the extreme temperature issues among others. See also many other Podcasts from James Taylor and the Heartland Environmental and Climate News site.
--------------------
NOAA outsources climate data management
Anthony Watts, Watts Up With That
No mention in this press release of what it might actually accomplish. Meanwhile a full scale siting assessment and quality control analysis of the entire NWS COOP network remains undone. On the plus side, they won’t now be able to use the CRU excuse of “we are understaffed” to avoid the FOIA requests surely coming their way. h/t to Joe DAleo/John Coleman - Anthony
Contact: John Leslie FOR IMMEDIATE RELEASE
301-713-0214 Sept. 16, 2010
NOAA Awards Contract to Manage Climate Data Records
NOAA officials today announced that Global Science & Technology, Inc., of Greenbelt, Md., has been awarded a contract to help manage the agency’s satellite Climate Data Records (CDR) program, which is based at NOAA’s National Climatic Data Center in Asheville, N.C.
The contract has a one-year base period, with two one-year option periods. The total contract value is $10,307,788.80. The contract will enable Global Science & Technology to add up to 25 jobs at NCDC’s Asheville location.
Scientists use CDRs to detect, assess, model and predict climate change and variability. Decision-makers use this information to develop effective strategies to adapt to and mitigate the impacts of climate change in their local communities.
Through this contract, Global Science & Technology, Inc. will provide management support of the CDR program, including project control and oversight services, system and product development, and customer and community outreach.
“Global Science & Technology, Inc. brings experience as an industry leader to the CDR program, which is developing some of the most important climate data products in the world,” said Scott Hausman, acting director of NOAA’s NCDC.
Commenter Billyquiz says:
September 17, 2010 at 9:21 am
“At our 2008 corporate retreat, GST decided to embrace a “green” philosophy to address our dependence on petroleum (as both a company and as individual employees) and the threat that global warming has to life on Earth.” Gatekeeping anyone?
NOAA’s NCDC is the largest environmental data center in the world. NCDC data help the scientific community and policymakers assess global climate variability and trends. The work on this contract will support the suite of climate services that NOAA provides government, business and community leaders, so they can make informed decisions.
“This is a remarkable opportunity for the National Climatic Data Center and for western North Carolina to expand our climate research and create up to 25 new high-paying, stable jobs in our area,” said Rep. Heath Shuler. “NCDC is home to the world’s most impressive and comprehensive collection of climate data, and this is one more step forward in making our mountain region unsurpassed in climate research in America.”
Scientists, researchers and leaders in government and industry use monthly U.S. and global temperature reports from NCDC to help track trends and other changes in the world’s climate. These climate services have a wide range of practical uses, from helping farmers know what and when to plant, to guiding resource managers with critical decisions about water, energy and other vital assets.
NOAA’s mission is to understand and predict changes in the Earth’s environment, from the depths of the ocean to the surface of the sun, and to conserve and manage our coastal and marine resources.
Commenter Mike Haseler says:
September 17, 2010 at 9:38 am
In the UK, government statistics are normally outsourced when they want to avoid things like FOI law and being subject to parliamentary scrutiny...it also makes it a lot easier for the next administration just to dump the whole thing!
See more comments here.
By Marc Kavinsky and Ashley Sears, NWS Milwaukee
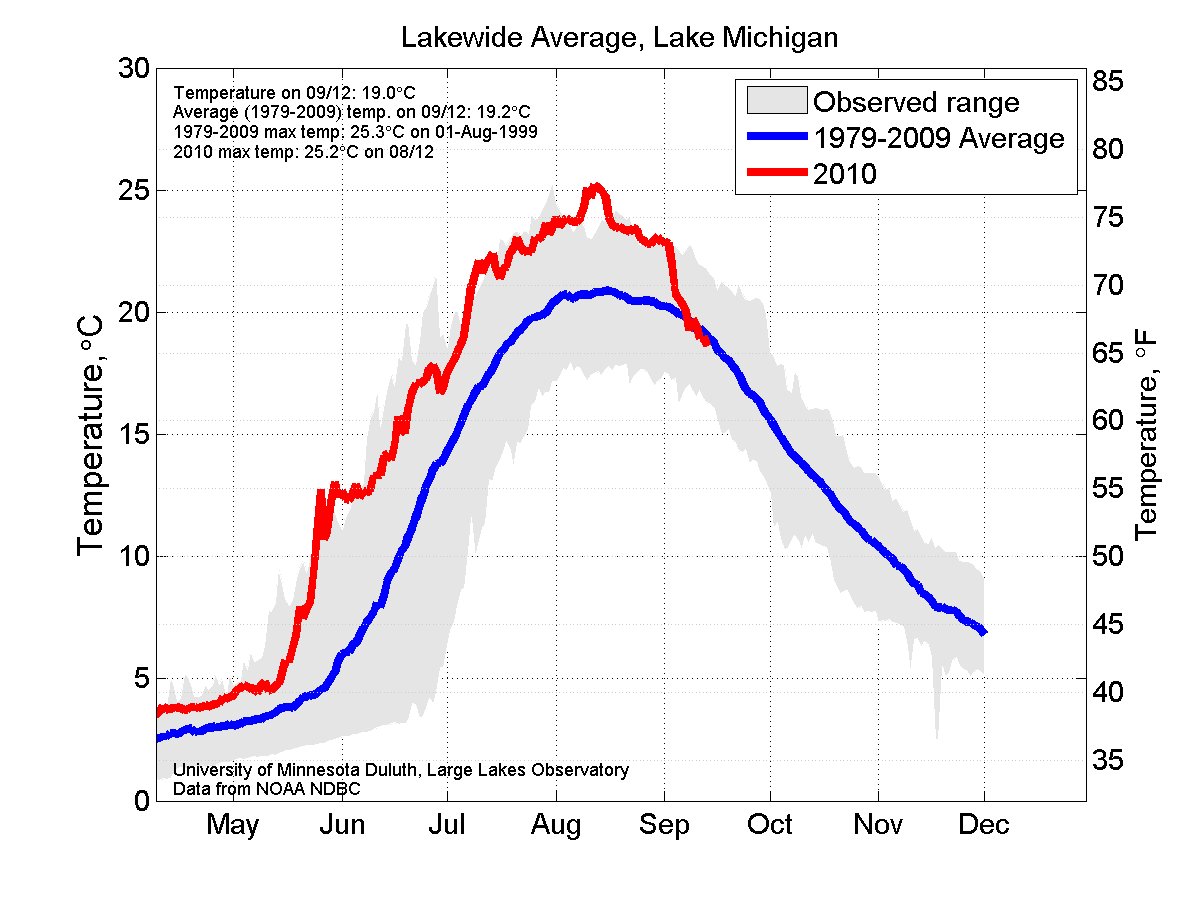
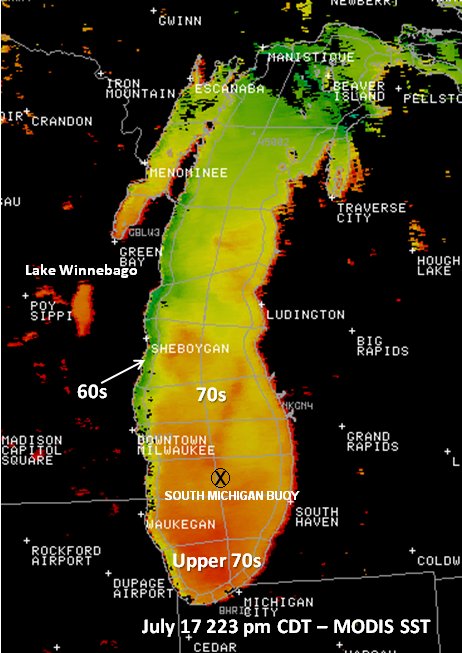
The prolonged period of unseasonably warm temperatures during July and August across southern Wisconsin and surrounding regions pushed the Lake Michigan sea surface temperature to 80 degrees several times during the month of August at the south Lake Michigan buoy located 43 miles east-southeast of Milwaukee. The buoy reached 80F on August 1st, August 10th, and August 12th.
Checking the historical database for the south Lake Michigan buoy which dates back to 1981, the warmest sea surface temperature ever recorded at the south Lake Michigan buoy was 81 degrees, set on August 18th, 1995. Overall, the buoy has recorded temperatures at 80 or above just six times between the time period of 1981 and 2009, with all occurrences being recorded in the month of August.
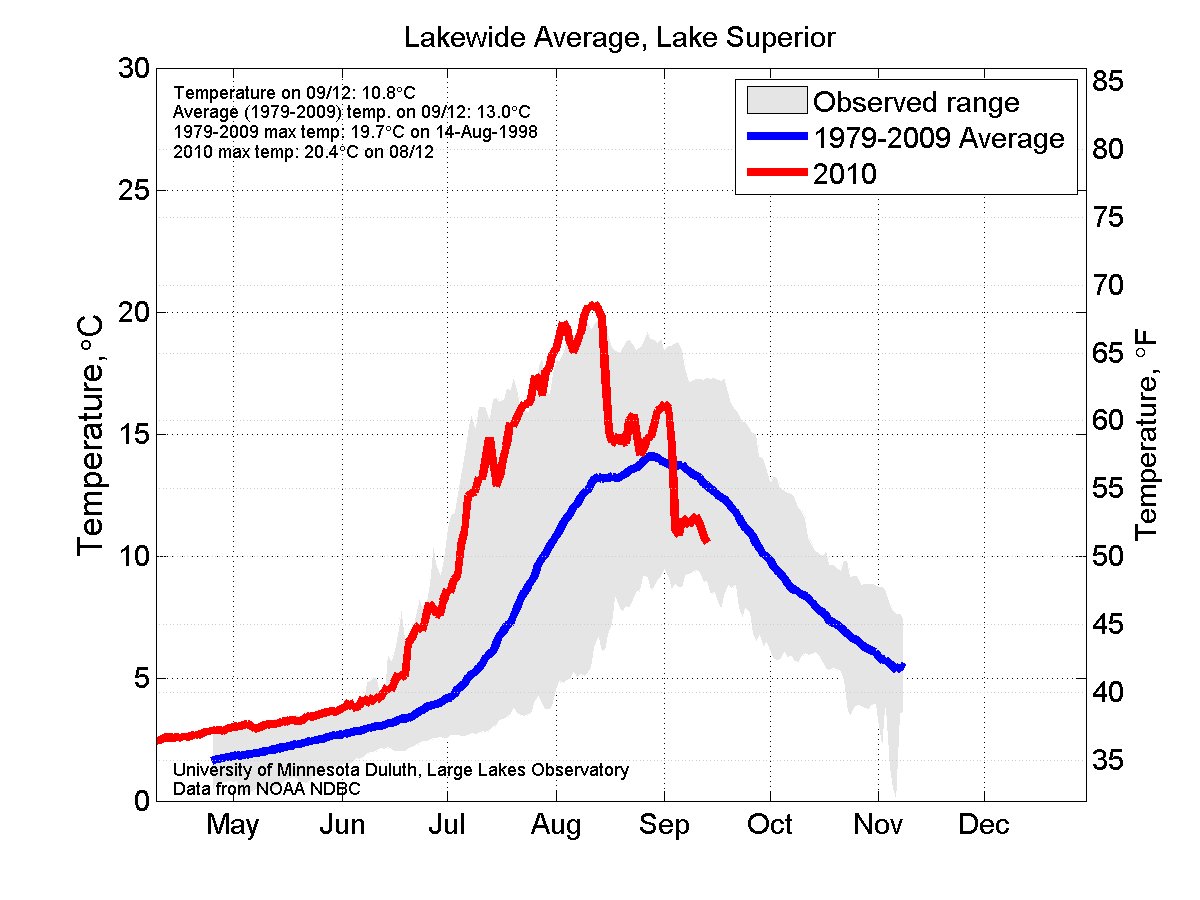
The two graphics below compare the average daily sea surface temperature from April through September 13 across Lake Michigan (graphic 1) and Lake Superior (graphic 2) to the 30 year sea surface temperature average for the individual lakes. The daily average temperature for each lake is depicted by the red line. The blue line provides the 30 year average. Comparing the daily average to the 30 year average, it can be noted that both Lake Michigan and Lake Superior have observed above normal temperatures through the summer months. The sharp decrease, especially recorded in the Lake Superior observations, is contributed to two major wind events that occurred in early September that allowed mixing of the lake, bringing the cooler temperatures to the surface.

Enlarged here.
Enlarged here.
Graphics Courtesy of Jay Austin, Large Lakes Observatory - University of Minnesota, Duluth. Data Courtesy of the National Data Buoy Center
The sea surface temperature image below taken by the Moderate Resolution Imaging Spectroradiometer (MODIS) equipment on a polar orbiting satellite in mid-July show the sea surface temperature had warmed into the middle to upper 70s across the southern mid-lake waters.
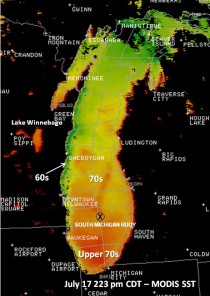
Enlarged here.
The below sea surface temperature image taken by the Advanced Very High Resolution Radiometer (AVHRR) equipment on a polar orbiting satellite on September 12th shows that the sea surface temperature had cooled into the middle 60s in the southern mid-lake waters. Sea surface temperatures just east of Southeast Wisconsin have cooled into the 50s.
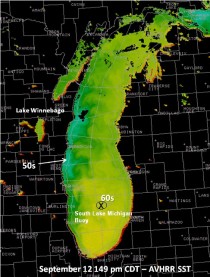
Enlarged here.
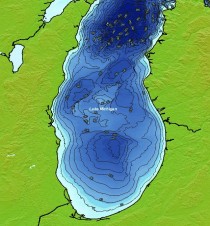
The coolest temperatures were located east of Port Washington and Sheboygan, where a steeper dropoff in the bathymetry of Lake Michigan and deeper, colder waters were located.
Enlarged here.
Check out the NOAA National Geophysical Data Center Great Lakes Bathymetry viewer.
See this post here.
Source: Telegraph of London
By James Delingpole
President Obama’s Science Czar John Holdren is worried about global warming. Having noticed that there hasn’t actually been any global warming since 1998, he feels it ought to be called “global climate disruption” instead. That way whether it gets warmer or colder, wetter or drier, less climatically eventful or more climatically eventful, the result will be the same: it can all be put down to “global climate disruption.”
And that will be good, because it will give Holdren the excuse to introduce all the draconian measures he has long believed necessary if “global climate disruption” is to be averted: viz, state-enforced population control; a rewriting of the legal code so that trees are able to sue people; and the wholesale destruction of the US economy ("de-development") as he put it in the 1973 eco-fascist textbook he co-wrote Paul and Anne Ehrlich Human Ecology: Global Problems And Solutions).
Holdren is not the only person having problems with the “world not warming and everyone growing increasingly sceptical” issue. So too is Dave “Grocer” Cameron’s excuse for a government. Its solution? Work out ways of brainwashing the populace with state-funded propaganda.
One solution, proposed by some bright spark at Bristol Poly - whoops, the “University of the West of England” as it now grandiosely refers to itself - is to have all climate sceptics classed as delusional freaks. His name is Professor Paul Hoggett and, as Dennis Ambler recalls in an excellent new report for the SPPI, last year he organised a whole conference on this theme:
Conference Facing Climate Change, Climate Change Denial
University of the West of England, 7 March 2009
“Man-made climate change poses an unprecedented threat to the global ecosystem and yet the response, from national policy makers right through to individual consumers, remains tragically inadequate. The Centre for Psycho-Social Studies at the University of the West of England is organising a major interdisciplinary event Facing Climate Change on this topic at UWE on 7 March 2009.
Facing Climate Change is the first national conference to specifically explore ‘climate change denial’.
This conference aims to strengthen our awareness of the challenge facing us and to enhance our capacity for effective decision-making and action. It will do this by bringing together a group of people - climate change activists, eco-psychologists, psychotherapists and social researchers - who are uniquely qualified to assess the human dimensions of this human-made problem.
Professor Paul Hoggett is helping to organise the conference, he said, “We will examine denial from a variety of different perspectives - as the product of addiction to consumption, as the outcome of diffusion of responsibility and the idea that someone else will sort it out and as the consequence of living in a perverse culture which encourages collusion, complacency, irresponsibility.”
Scarier still, though, is this new report from the Climate Change Communication Advisory Group - an “independent” body part financed by the government’s Economic and Social Research Council - called Communicating Climate Change To Mass Public Audiences.
Essentially, it is a propaganda advisory document designed to help the government correct its populace’s false consciousness. Dr Goebbels, I’m sure, would have been full of admiration for sections like this:
Encourage public demonstrations of frustration at the limited pace of government action...Climate change communication could (and should) be used to encourage people to demonstrate (for example through public demonstrations) about how they would like structural barriers to behavioural/societal change to be removed.
Can this be for real? Here the government is being advised by one of its own think tanks how to railroad through its climate policies by encouraging mobs of activists to stage ‘spontaneous’ protests demanding action which the majority of the electorate don’t actually want. I know this sort of thing happens all the time in Pyongyang, Teheran and Caracas. But in Britain? See James post here.
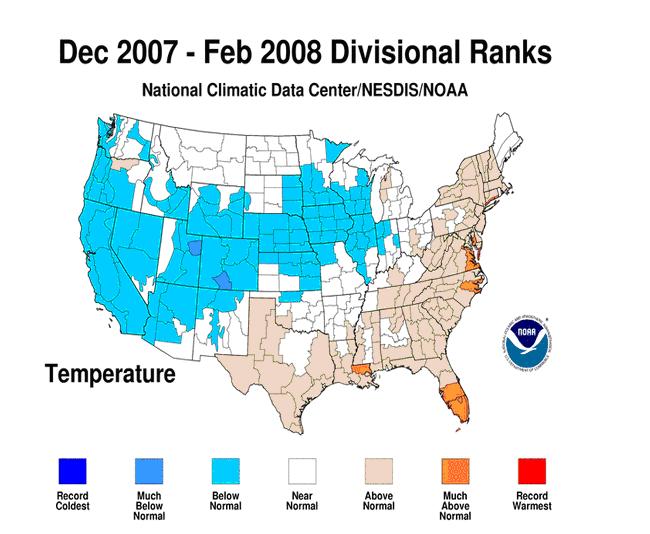
Washington DC and many cities of the east and south had a warm to record warm summer (while parts of the west had a cold to record cold) with the average for the nation the 4th warmest on record. For Washington, it broke many of the records set in 1980 and 1988. It tied with the number of 90F days set in 1988 and fell just 12 days short of the number of 90F days for the year (a few additional still possible) set in 1980.
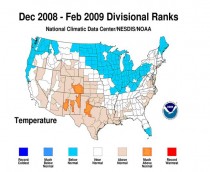
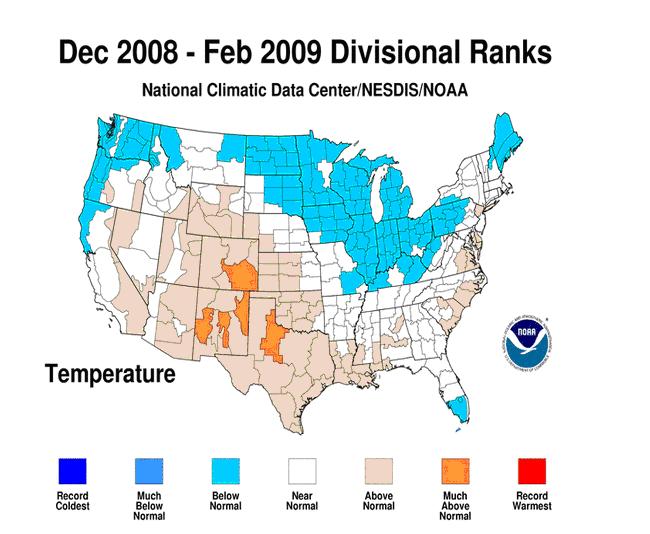
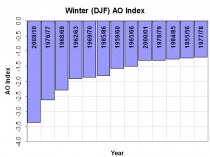
A hot summer is very typical when a strong La Nina follows a strong El Nino winter (1999, 1988, 1966) or when record strong arctic blocking in winter fades (1977). This past winter we saw a record for negative Arctic Oscillation (AO) beating out 1976/77 and 1965/66 (below, enlarged here).
The summer was 2.2F above normal for the nation, ranking it as fourth warmest (below, enlarged here).

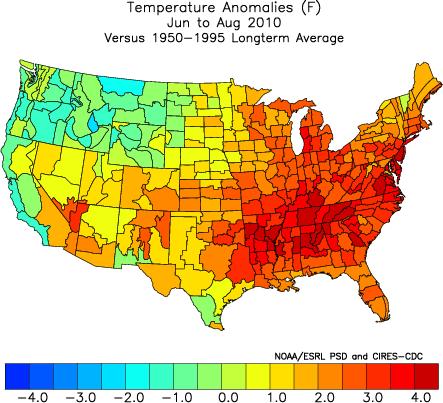
That matches how much last winter the US averaged below normal (2.2F). Last winter was coldest in the south and southeast (in a few spots, coldest ever). Colder to the south of DC but recall DC and surroundings had a record seasonal snowfall (below, enlarged here).
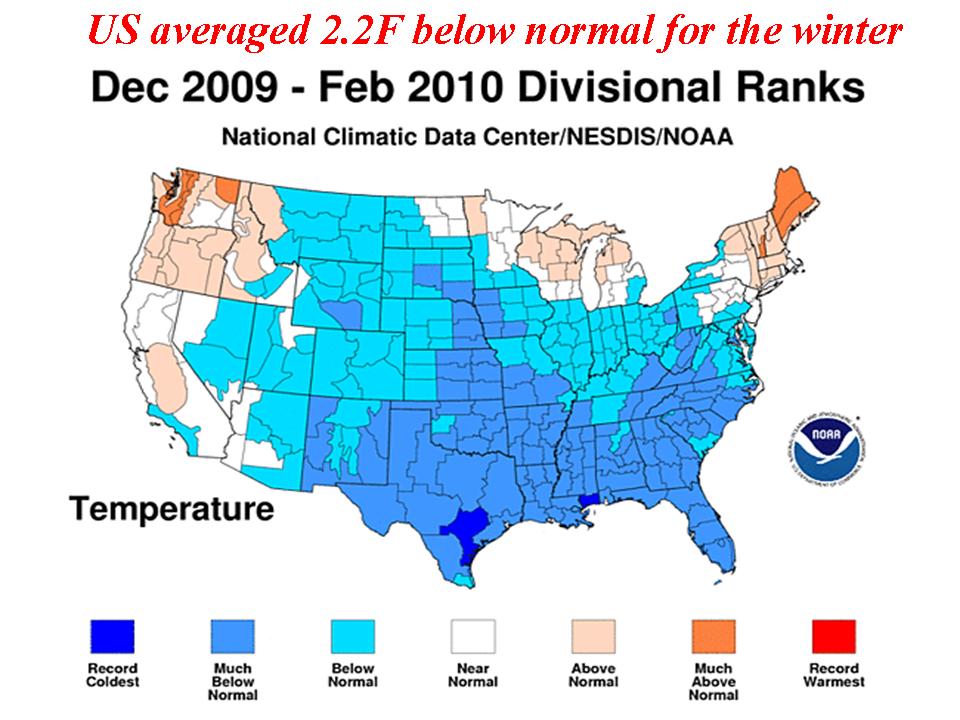

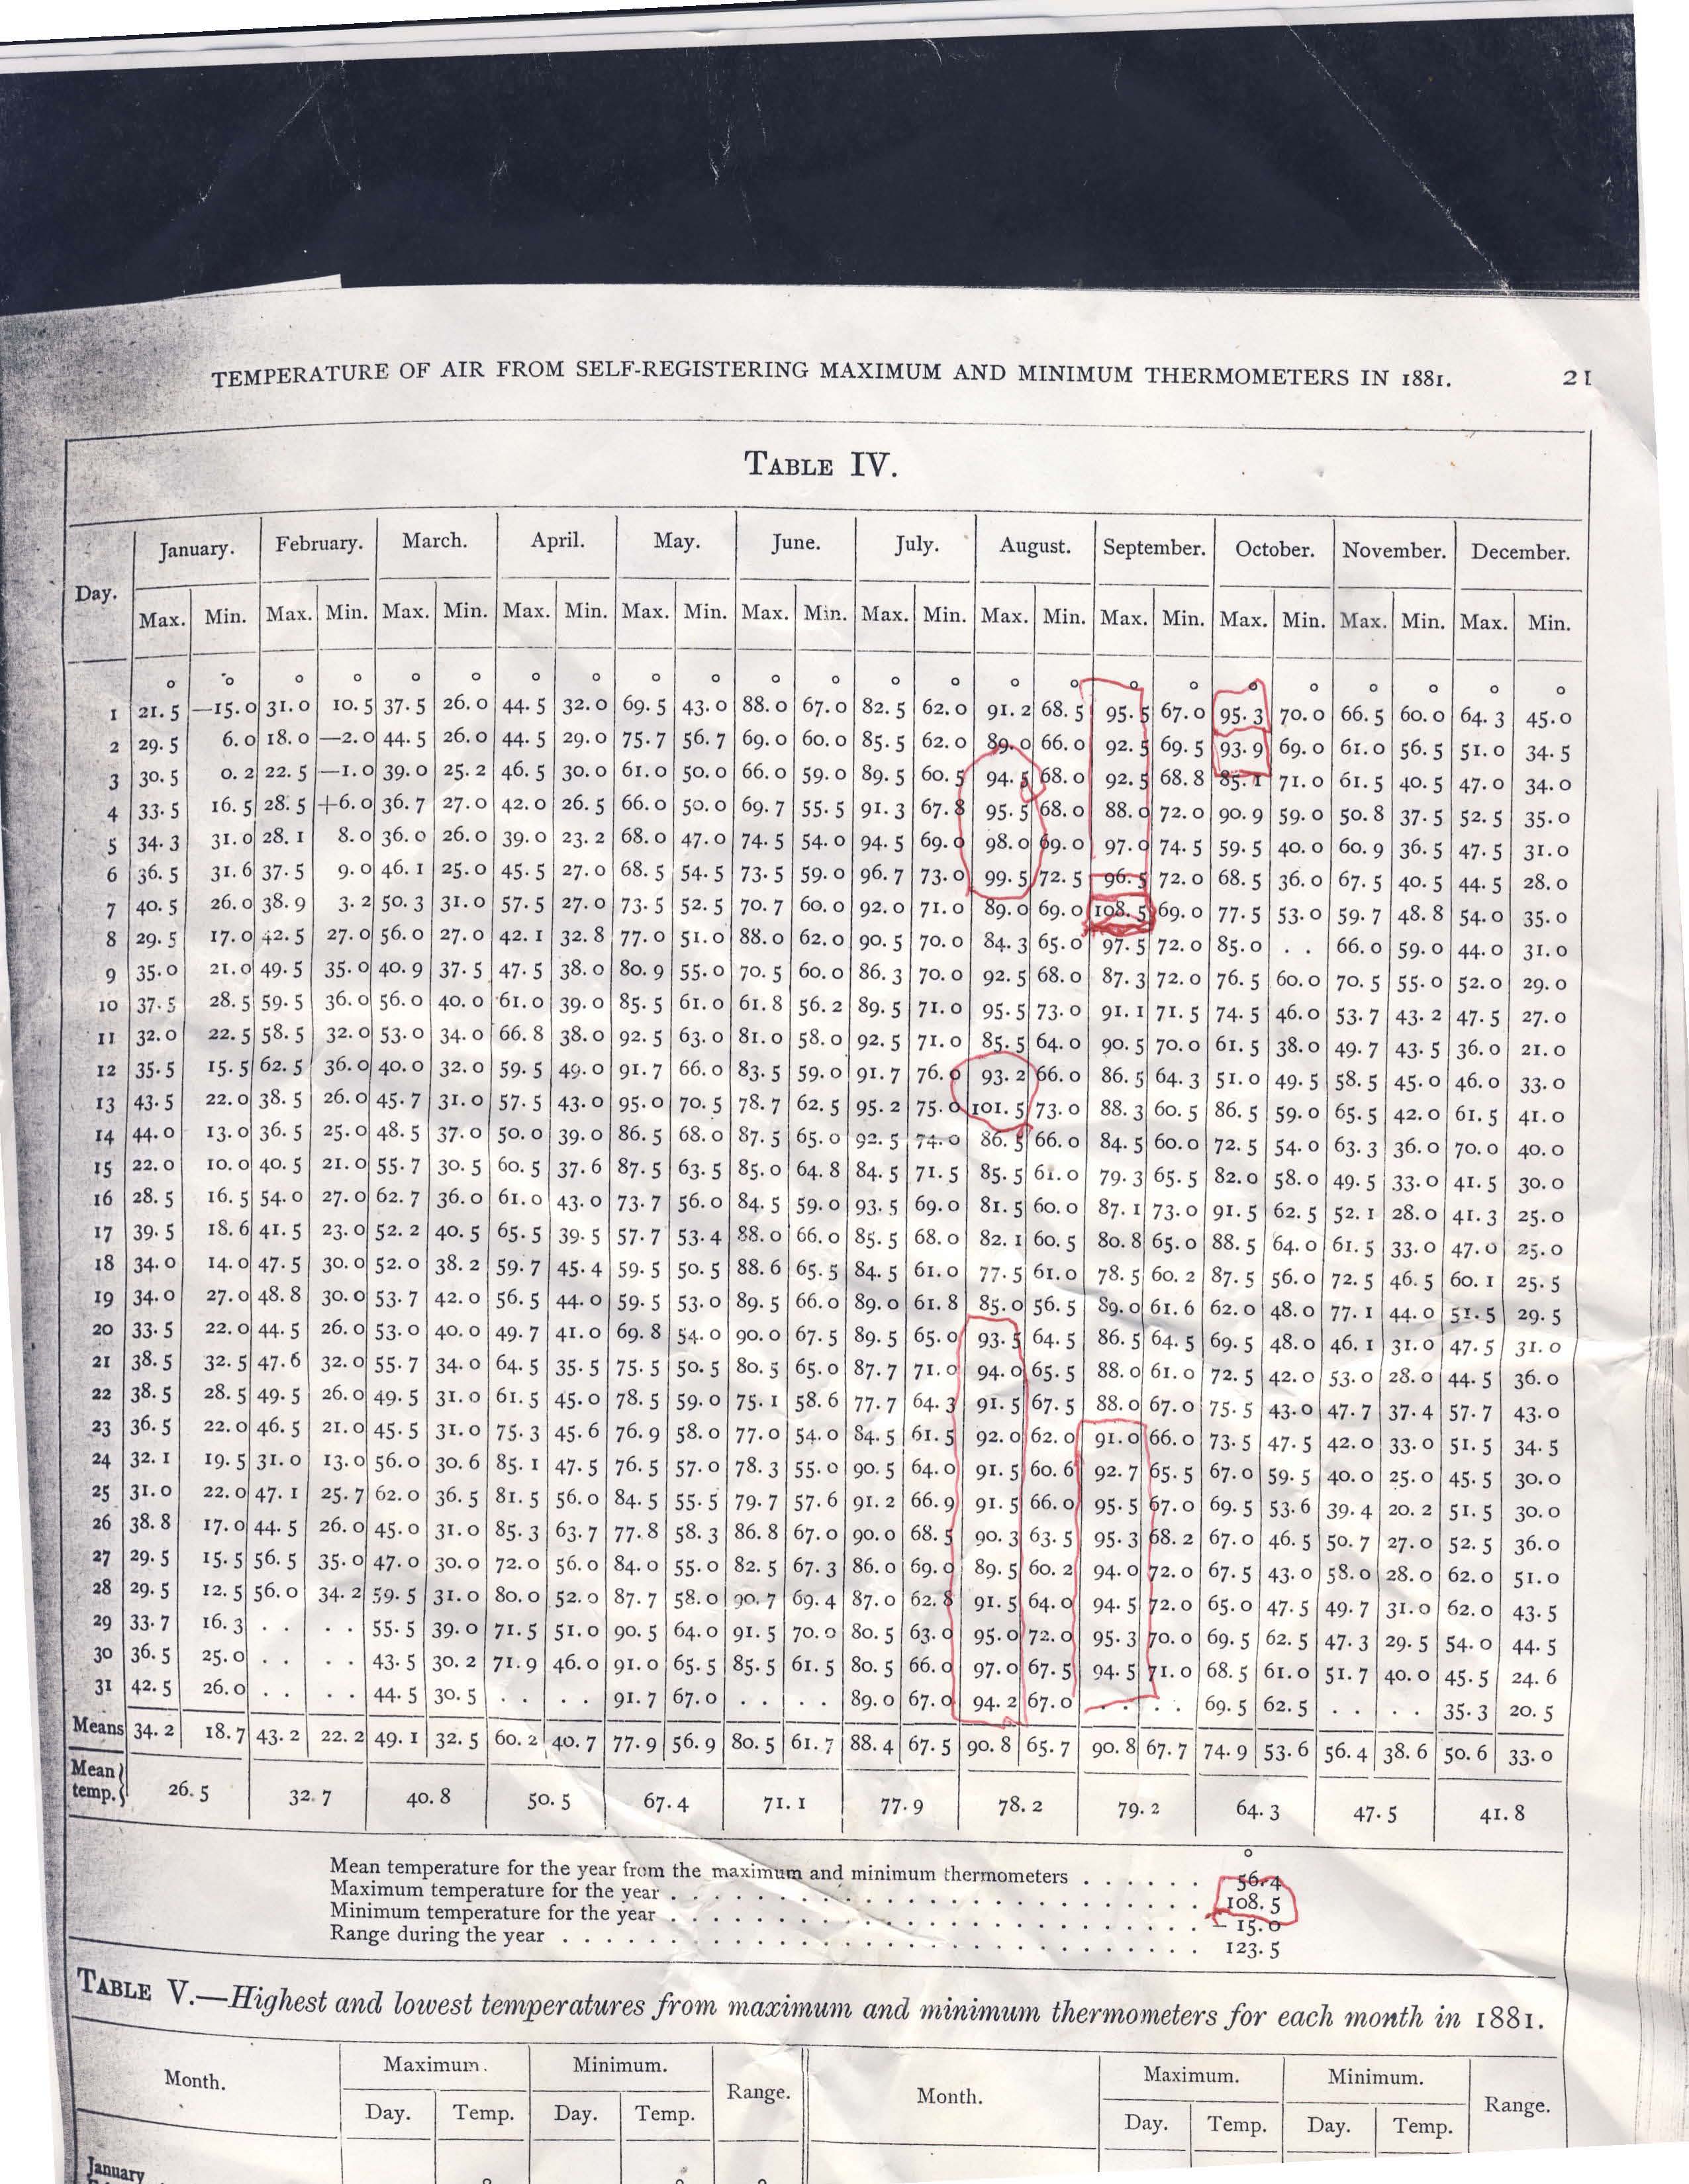
Besides 1980, 1988, other hot summers included 1881, where this record from “Andy” out of the Naval Observatory shows an amazing summer following a very cold January/winter. He writes:
I am attaching a rather rare document, Washington DC weather records for the year 1881 taken at the Naval Observatory.
I have highlighted an incredible late summer, early autumn heat wave that got started on August 20th and did not really end until October 4th. There has never been anything remotely approaching the intensity and duration of this heat wave for so late in the year in modern times.
An unbelievable temperature of 108.5 was recorded on the very late date of September 7th! Also the average September average high temperature of 90.8 dwarfs anything you can find in recent years. One could argue that the site or thermometer might reflect a warm bias. Examining the data, June was actually quite cool and July was about average. And back then, no one was pushing an agenda!
The summer this year was characterized by hot days with high humidities and thus very warm nights. Nighttime lows were especially above the normal. Ironically many of the same areas with warmth this summer had very cool summers the last two years with a record/near record cold July in 2009 (below, enlarged here).

That was consistent with a summer after a La Nina winter, one with low solar and high latitude volcanic activity. Last summer and last winter we were told that was weather not climate. This makes any claims that a hot summer this year is indicative of a warming world disengenuous. With La Nina coming on, look for a cool summer again next year. With a negative PDO look for colder years ahead. This will accelerate when the Atlantic cools. The active hurricane season will remove some of the heat built up in the Atlantic by the El Nino suppressed activity last year and reduced winds (mixing) and increased sunshine with a suppressed jet stream, weakened suppresed subtropical high pressure due to record blocking this past winter.
--------------------
NOAA outsources climate data management
Anthony Watts, Watts Up With That
No mention in this press release of what it might actually accomplish. Meanwhile a full scale siting assessment and quality control analysis of the entire NWS COOP network remains undone. On the plus side, they won’t now be able to use the CRU excuse of “we are understaffed” to avoid the FOIA requests surely coming their way. h/t to Joe DAleo/John Coleman - Anthony
Contact: John Leslie FOR IMMEDIATE RELEASE
301-713-0214 Sept. 16, 2010
NOAA Awards Contract to Manage Climate Data Records
NOAA officials today announced that Global Science & Technology, Inc., of Greenbelt, Md., has been awarded a contract to help manage the agency’s satellite Climate Data Records (CDR) program, which is based at NOAA’s National Climatic Data Center in Asheville, N.C.
The contract has a one-year base period, with two one-year option periods. The total contract value is $10,307,788.80. The contract will enable Global Science & Technology to add up to 25 jobs at NCDC’s Asheville location.
Scientists use CDRs to detect, assess, model and predict climate change and variability. Decision-makers use this information to develop effective strategies to adapt to and mitigate the impacts of climate change in their local communities.
Through this contract, Global Science & Technology, Inc. will provide management support of the CDR program, including project control and oversight services, system and product development, and customer and community outreach.
“Global Science & Technology, Inc. brings experience as an industry leader to the CDR program, which is developing some of the most important climate data products in the world,” said Scott Hausman, acting director of NOAA’s NCDC.
Commenter Billyquiz says:
September 17, 2010 at 9:21 am
“At our 2008 corporate retreat, GST decided to embrace a “green” philosophy to address our dependence on petroleum (as both a company and as individual employees) and the threat that global warming has to life on Earth.” Gatekeeping anyone?
NOAA’s NCDC is the largest environmental data center in the world. NCDC data help the scientific community and policymakers assess global climate variability and trends. The work on this contract will support the suite of climate services that NOAA provides government, business and community leaders, so they can make informed decisions.
“This is a remarkable opportunity for the National Climatic Data Center and for western North Carolina to expand our climate research and create up to 25 new high-paying, stable jobs in our area,” said Rep. Heath Shuler. “NCDC is home to the world’s most impressive and comprehensive collection of climate data, and this is one more step forward in making our mountain region unsurpassed in climate research in America.”
Scientists, researchers and leaders in government and industry use monthly U.S. and global temperature reports from NCDC to help track trends and other changes in the world’s climate. These climate services have a wide range of practical uses, from helping farmers know what and when to plant, to guiding resource managers with critical decisions about water, energy and other vital assets.
NOAA’s mission is to understand and predict changes in the Earth’s environment, from the depths of the ocean to the surface of the sun, and to conserve and manage our coastal and marine resources.
Commenter Mike Haseler says:
September 17, 2010 at 9:38 am
In the UK, government statistics are normally outsourced when they want to avoid things like FOI law and being subject to parliamentary scrutiny...it also makes it a lot easier for the next administration just to dump the whole thing!
See more comments here.
By S. Fred Singer, President, Science and Environmental Policy Project
“The Hockey Stick Illusion: Climategate and the Corruption of Science.” By A.W. Montford. Stacey International. London. 2010. 482pp.
Andrew Montford, a Scot, blogs under the name of Bishop Hill. I have not met him personally, but in correspondence with him I generally address him as Your Grace a bit of humor.
This is probably the best book about the Hockey Stick. And while some of the detail may be overwhelming to the innocent reader, it does present all of the relevant facts as far as I can tell. You will not only become an expert on tree rings, and get to know trees by their “first name,” so to speak, but you will also get to learn about difficult statistical concepts, such as “principal component analysis.” PCA is an important statistical technique and one which the originator of the Hockey Stick, Professor Michael Mann, apparently failed to fully grasp.
There is little one can add to Montford’s comprehensive account, so I will just supply some personal details. My own involvement in the hockey-stick affair is of no real consequence—and certainly not as important as that of the Canadians, Steven McIntyre and Ross McKitrick. They are the ones who “broke the Hockey Stick,” and Professor Edward Wegman of George Mason University, an expert statistician, provided the finishing touches.
I first learned of the Hockey Stick by reading the original paper by Mann, Bradley, and Hughes in Nature in 1998 and was surprised that it showed an extended decline of global (or NH) temperatures since the year 1000AD, until a sudden and major warming in the 20th century (the “blade” of the Hockey Stick). But providing some reassurance, there seemed to be good overlap between 1900 and 1980 with the instrumental record of Phil Jones, which showed a continuing rise in temperature from 1980 to the end of the century.
I had no basis to question the MBH work, but I noticed that the proxy record suddenly stopped in 1980 and did not extend beyond.
At that time, I was heavily influenced by the satellite data of Christy and Spencer that showed no atmospheric warming trend from 1979 to 1997—in contrast to Jones’ surface data from weather stations. Since Mann was using the Jones temperature data for calibration of the proxy record, I asked Mann if he had any post-1980 proxies. He replied rather brusquely that there were no suitable data available. This was my only exchange with Mann, and I’ve preserved those emails.
Of course, I did not believe Mann, since I knew of tree ring data (by Jacoby in 1996) that showed no temperature rise since 1940 (see figure 16 in my 1997 book Hot Talk Cold Science). I also knew that Dahl-Jensen’s ice cores showed no temperature rise since 1940. Hence I had doubts about the Jones dataand still do.
Following this unsatisfactory e-mail exchange with Mann, I had correspondence with McIntyre, Charles Keller, and others, trying to collect some post-1980 proxies to decide whether the Jones record was sound—and whether Mann had stopped his proxy record in 1980 because it did not agree with Jones. Today we know, thanks to Climategate, that this might have been “Mann’s Nature trick” in order to “hide the decline [of temperature].”
I visited Ed Cook at the Lamont Geophysical Laboratory to get post-1980 tree ring data, but was unsuccessful and finally gave up and turned to other matters. I also had a chance to speak briefly to Mann at the University of Virginia in Charlottesville, but could not extract any information from him. By then, he clearly regarded me as an ‘enemy’ and would not have given me anything of value.
My next encounter with the Hockey Stick was to review the IPCC’s 3rd Assessment draft report in 2000. In the draft, the Hockey Stick was represented along with the Jones instrumental record, using colors of black and blue. I prevailed on IPCC to use colors that were easily distinguishable and was glad to see the Jones record appearing in red in the final IPCC version.
My next encounter came in 2003 when the editor of Energy & Environment sent me the first of the McIntyre and McKitrick papers for review. I was surprised to learn of some half dozen or so cases where Mann had clearly mishandled the data, even substituting imaginary sequences to fill gaps where data were not available. Of course, I endorsed publication of this first of the M&M attacks on the Hockey Stick.
I also witnessed the encounter between Mann and McIntyre at the hearings arraigned by the National Academy (NAS), charged to write a report on the Hockey Stick. Tellingly, Mann presented a brief account of his work and then immediately walked out without taking any questions or listening to the McIntyre presentation. It was a thoroughly disappointing performance, particularly since some have misinterpreted the NAS report as an endorsement of the Hockey Stick. Actually, it was just the opposite, but it was misleading. The NAS stated that the 20th century was the warmest in the last 400 years, without making it clear that 400 years ago the earth was in the depth of the Little Ice Age.
It is certainly noteworthy that the IPCC in its fourth assessment report [2007] no longer displays the Hockey Stick. It had been demolished by able statisticians like Wegman and von Storch. M&M had shown in the meantime that random numbers fed into the Mann algorithm would always produce a hockey-stick-shaped result.
The “Last Hurrah” for the Hockey Stick came in 2009 in a report by the United Nations Environment Program. Apparently, UNEP wanted to dramatize matters before the crucial Dec 2009 Copenhagen meeting and brought back the Hockey Stick in an inexpertly written report on climate change. They called it an “update” of the IPCC, but I’m sure that responsible IPCC scientists would not have agreed with that characterization. When we inquired where their Hockey Stick graph originated, we were led to a Norwegian biologist who had republished a graph he had found in Wikipedia - too funny for words! UNEP immediately reissued their report and replaced their Hockey Stick graph with a less controversial one.
There is a serious matter, however, which bears discussion: Did Mann commit fraud? I would give him the benefit of the doubt and suggest that his initial Nature publication contained many errors, including major statistical ones, which he might not have been aware of. But certainly, after these errors had been pointed out to him in no uncertain terms, how could he maintain his original posture and claim that the Hockey Stick truly represented the global temperature record of the last 1000 years? All this in spite of many publications, both before and after 1998, that clearly told a different story: The compilation of temperature values by Soon and Baliunas, who were viciously attacked by the IPCC crowd; the isotope data of Cuffey; the global proxy data (omitting tree rings) of Loehle, which clearly showed the medieval warm period to be warmer than today; the deep-sea sediment record of Kegwin; and, of course, the historical record.
The Attorney General of the Commonwealth of Virginia, Kenneth Cuccinelli, is currently engaged in extracting from the University of Virginia (where Mann was a faculty member from 1999 to 2005) the e-mail records and other material relating to Mann. The University is fighting this demand in court yet it had already agreed some months ago to deliver the e-mail records of Patrick Michaels to Greenpeace! At that time, no cries of “academic freedom” were raised by the usual suspects. The silence then, and vociferous objections now expose the hypocrisy of the UVa Faculty Senate, the AAUP, the AAAS, and the Union of Concerned Scientists.
It is quite likely that Cuccinelli will discover a “smoking gun.” Perhaps some of the emails that Phil Jones admitted to having deleted might tell us just when Mann became himself aware that the Hockey Stick was bogus and a fraud. - -
Tom Nelson reports here.
Brrrr!
Peru is going through its coldest winter in 50 years and hundreds of people and thousands of animals have already died of hypothermia as temperatures have fallen to record -23C lows in the mountain villages. But while this year’s cold has been put down to a periodic La Niña phenomenom, scientists here are convinced the bigger picture in the Andes is of progressive climate change.
Retreating glaciers, wild fluctuations of temperatures, unseasonal weather patterns, unpredictable frosts and extreme weather events are all consistent with climate change models.
Global warming is ‘bulls--t,’ says Ryanair boss
Iceage Now
The scientific consensus is “horses--t”. In an interview with The Independent, the chief executive of Europe’s largest airline branded the scientific consensus that man-made pollution is heating the planet as “horses--t.”
Ryanair’s combative boss Michael O’Leary agreed the climate was changing but denied it was caused by man-made emissions of carbon dioxide. “Nobody can argue that there isn’t climate change. The climate’s been changing since time immemorial,” he said.
“It’s amazing the way the whole f---ing eco-warriors and the media have changed. It used to be global warming, but now, when global temperatures haven’t risen in the past 12 years, they say ‘climate change’.”
“Well, hang on, we’ve had an ice age. We’ve also had a couple of very hot spells during the Middle Ages, so nobody can deny climate change. But there’s absolutely no link between man-made carbon, which contributes less than 2pc of total carbon emissions [and climate change].”
“Scientists argue there is global warming because they wouldn’t get half of the funding they get now if it turns out to be completely bogus,” he said.
“The scientific community has nearly always been wrong in history anyway. In the Middle Ages, they were going to excommunicate Galileo because the entire scientific community said the Earth was flat… I mean, it is absolutely bizarre that the people who can’t tell us what the f---ing weather is next Tuesday can predict with absolute precision what the f---ing global temperatures will be in 100 years’ time. It’s horses--t.”
O’Leary mocked global warming campaigners, describing the United Nations as “one of the world’s most useless organisations”, its Intergovernmental Panel on Climate Change (IPCC) as “utter tosh”, and US politician Al Gore as someone who “couldn’t even get f---ing re-elected” after a boom.
Investors Business Daily Editorial
Eco-Extremism: A light bulb factory closes in Virginia as mandated fluorescents are made in China. It’s now a crime to make or ship for sale 75-watt incandescent bulbs in the European Union. Welcome to green hell.
Thomas Alva Edison was a genius credited with the invention of many things - the phonograph, the motion picture, the incandescent light bulb, global warming. That last credit was given by those who rank light bulbs right up there with the internal combustion engine as ravagers of the planet.
The General Electric light bulb factory in Winchester, Va., closed this month, a victim, along with its 200 employees, of a 2007 energy conservation measure passed by Congress that set standards essentially banning ordinary incandescents by 2014.
Just as they are by fuel-economy standards, consumers are denied choice and the freedom to evaluate any possible benefits on their own by the nanny state. Washington’s force and coercion are necessary because it seems the great unwashed can’t seem to see the benefits or ignore the risks of compact fluorescents, or CFLs.
In Europe, light bulbs are already a controlled substance. The 100-watt bulb was banned last year and the 75-watt became illegal as of Sept. 1.
Not surprisingly, incandescent light bulbs there quickly became a hot item, flying off the shelves while they were still available. Der Spiegel reported that German customers leave hardware stores with carts piled high with enough incandescent bulbs to last 20 years. Garages and attics throughout the Old World are full of them.
It’s said that CFL bulbs are more economical in the long run because they supposedly use up to 80% less energy than old-style bulbs and don’t burn out as quickly. Though we’re not fully convinced of these claims, we do know that CFL bulbs are more expensive, costing up to six times as much as equivalent incandescent bulbs. Because they are made of glass tubes twisted into a spiral, they also require more hand labor and therefore cost more.
Due to the expense, CFLs are made largely in China, where labor is cheaper and environmental regulations not so strict. As with wind turbine blades, we are creating plenty of green jobs - in the People’s Republic.
Despite governments’ effort to market them, CFLs are not necessarily better. Tests conducted by the London Telegraph found that using a single lamp to illuminate a room, an 11-watt CFL produced only 58% of the illumination of an equivalent 60-watt incandescent - even after a 10-minute warm-up that consumers have found necessary for CFLs to reach their full brightness.
Lack of light isn’t the only drawback. CFLs apparently are so dangerous, the European Commission has to warn consumers of the environmental hazards they pose. If one breaks, consumers are advised to air out rooms and avoid using vacuum cleaners to prevent exposure to the mercury in the bulbs.
You can’t just throw an old bulb out, either. It must be properly disposed of lest your bedroom or family room become a Superfund toxic waste site.
Mercury is considered by environmentalists to be among the most toxic of toxic substances and, yes, it is dangerous if ingested or handled over time. We’ve been warned that high concentrations in fish are dangerous to pregnant women. We’ve been told mercury in vaccines causes autism. So it’s safe in light bulbs?
As we’ve found out here with energy regulation and taxes, and the push for cap-and-trade, governments don’t care what people want. Nor do they weigh the costs, the benefits and the risks of this or that. Government must mandate what’s good for us under penalty of law.
We still have time, though, before the lights go out. Our phase-out doesn’t begin until Jan. 1, 2012 - coincidentally an election year. When New Zealand faced a similar ban two years ago, it became an election issue for the National Party, at the time in the minority against the ruling Labour government.
In November 2008, the newly elected National Party overturned the light-bulb ban. This should make a light go on over the heads of GOP strategists seeking another issue against the nanny state. How about standing for light, liberty and the pursuit of happiness? See editorial here.
--------------
Turning Off the (Incandescent) Light of Liberty
By Alan Caruba
What if the government banned air conditioning? What if flat-screen televisions were determined to use too much electricity and were ordered phased out of production? What if the use of all plastic grocery bags were banned? What if the incandescent light bulb, one of the greatest inventions of Thomas Edison in the 1870s was banned? Oh wait, it has been banned!
In a nation where the Medicare “reform” requires Americans to purchase health insurance they may not want and may not be able to afford, was rammed through Congress, what can stop the government from dictating just about any choice you have regarding any purchase you make? The answer? Nothing.
Only it would no longer be a Constitutional government, a nation of laws that reflect anything resembling the truth. The ban on incandescent light bulbs turns off the light of liberty throughout America.
Here are some truths to keep in mind. (1) Carbon dioxide (CO2) along with other “greenhouse gas emissions” does not cause global warming. (2) There is no global warming. (3) The Earth has gone through known warming and cooling cycles for millions of years. (4) The Earth is in a cooling cycle.
(5) Beginning January 1, 2012, government rules will make it impossible to purchase a 100-watt incandescent light bulb. After that, in time, all such light bulbs will be phased out leaving Americans with only dim, over-priced, mercury-filled light bulbs. And (6) they will be made overseas, primarily in China.
By 2012, by order of the government, Americans will no longer be able to purchase any incandescent light bulbs. Why? Because Congress banned them, citing the need to reduce “greenhouse gas emissions” to reduce global warming that isn’t happening.
It’s the same Congress that had already determined how much water your toilet can use to flush. It’s the same Congress that determined “cafe” rules that determine how many miles per gallon your automobile must achieve. It’s the same government that requires ethanol be added to gasoline, thus reducing the mileage a gallon of adulterated gasoline can produce, while also driving up the cost of gasoline as well as of corn, a food product, used to produce ethanol.
It’s the same Congress that has blessed a Renewable Electricity Standard that requires utilities to use electricity produced by wind and solar power even though both sources also require 24/7 backup by traditional coal-fired, natural gas, or nuclear plants because they cannot be relied upon to generate electricity in a predictable fashion or during periods of peak capacity.
It’s the same Congress that initiated Fannie Mae and Freddie Mac, two “government entities” that purchased the sub-prime mortgage loans that banks and mortgage loan firms were required to make to people who clearly could not afford to repay them. The result is the financial crisis that occurred when those “bundled” mortgages turned out to be “toxic”, worthless paper sold to investment firms and banks as assets.
In early September, The Washington Post, published an article, “Light bulb factory closes; End of era for U.S. means more jobs overseas.” It reported that “The last major General Electric factory making ordinary incandescent light bulbs in the United States is closing this month...the remaining 200 workers at the plant here (Winchester, Virginia) will lose their jobs.”
In June, The Washington Times reported that the Federal Trade Commission earlier this month (released) 91 pages of regulations that will force manufacturers to revise their packaging and make costly compact fluorescent bulbs appear more appealing to consumers,” that they have refused to willingly purchase them. “Congress wants to force the pale, cold fluorescent curlicue fixtures on everyone because it makes members feel that they are doing their part to ‘save the planet’.”
While the ban was initiated in 2007 before the Obama administration took power, it has not gone unnoticed that the CEO of General Electric, Jeffrey Immelt, “sits on Obamas Economic Recovery Advisory Board.” And recovery is no where in sight while GE closes its factory making incandescent light bulbs.
There’s more. GE was the recipient of bailout funds and, according to an article on FrontPagemag.com, “stands to benefit from current and future contracts with the U.S. government.” Connect the dots. GE owns MSNBC, a cable news channel famous for its adulation of Obama before and since his election.
The issue, however, is far less about GE than it is about the vast global warming fraud, the equally vast matrix of U.S. laws and regulations that is based on it, and most importantly, the way they are being used to undermine and destroy the U.S. economy along with the freedoms that Americans take for granted.
One of the many tasks facing a Congress in which Republicans are expected to regain control in November is to repeal the ban on incandescent light bulbs. After that, the mountain of other laws and regulations strangling consumer freedom and even threatening the health of Americans must also be repealed.
All nations must evolve, but America is moving toward less freedom of choice; more control over the choices that a free market requires. It is rejecting its founding principles and it is doing so based on environmental lies. See post here.
By Dr. Richard Keen
At the end of each month, NCDC posts a “U.S. Climate at a Glance” summary on its website. The post features a color map of monthly mean temperature anomalies (departure from normal) for the entire U.S., based on an unspecified selection of stations.
It’s fun to find your home and pick out what the previous month was like there. I’ve done that for the past two months (June and July), and compared the analyzed departures to those actually measured at my NWS co-op station at Coal Creek Canyon, Colorado. For both months I found that the map departures calculated by NCDC for my location were about two degrees higher than the directly measured departure. The reports were posted on ICECAP and Watt’s Up With That, and last month I closed by saying..."I’ll keep checking this in future months, but I suspect the story will remain the same, with mystery adjustments inflating the temperature departures in one direction only.”
Now here is August’s report. I added the locations of Coal Creek Canyon and of the nearest NWS first-order station, Denver, to the map. On the map, both stations are within the +2F contour, with Denver approaching +4F. My best interpolation gives analyzed map departures of +2.5F at Coal Creek and +3.5F at Denver. Compare that to the actual departures (compared to the calculated normals for each station) of +1.2 and +2.1, respectively. Once again, the point departures in this part of Colorado are inflated by more than one degree.
Here is a list of the compared departures and Coal Creek and Denver for June, July, and August, 2010. The story is consistent - the NCDC analysis has the summer of 2010 running 3 degrees hotter than normal, while the observations have warm anomalies of less than half that. Those “mystery adjustments” raised Colorado’s summer temperature by 2 degrees above the direct measurements. Keep in mind that this two degree discrepancy is greater than the alleged “Climate Change” signal to date.
As I noted earlier, this is simply a spot check of two of NCDCs 2000 grid points. But Denver is a major first-order station, and Coal Creek has been a stable station with no moves or urban influences for almost 30 years, and the instruments are meticulously maintained. Coal Creek is at 8950 feet elevation in the Colorado Rockies, a region predicted by all models referenced by the IPCC to have the greatest warming in the “lower 48” United States. According to NCDC analyses, this warming is occurring. According to actual observations, it is not.

See enlarged here.
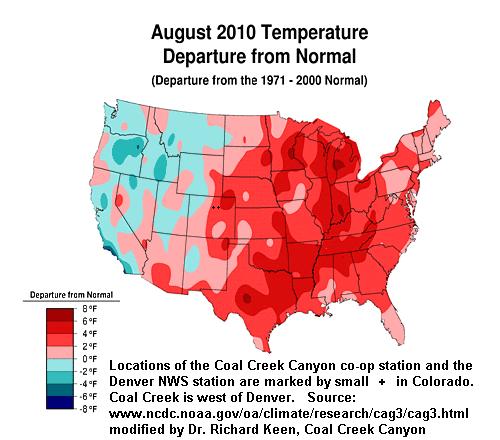

See enlarged here.
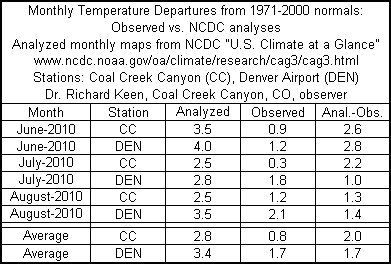
See PDF here.
------------------
Multidecadal Tendencies in ENSO and Global Temperatures Related to Multidecadal Oscillations
Energy & Environment, Volume 21, Numbers 5, pp. 437-460, September 2010, Joseph D’Aleo, Don Easterbrook
Abstract: Perlwitz etal (2009) used computer model suites to contend that the 2008 North American cooling was naturally induced as a result of the continent’s sensitivity to widespread cooling of the tropical (La Nina) and northeastern Pacific sea surface temperatures. But they concluded from their models that warming is likely to resume in coming years and that climate is unlikely to embark upon a prolonged period of cooling. We here show how their models fail to recognize the multidecadal behavior of sea surface temperatures in the Pacific Basin, which determines the frequency of El Ninos and La Ninas and suggests that the cooling will likely continue for several decades. We show how this will be reinforced with multidecadal shift in the Atlantic (and declining solar activity).
See publication here. More to come.
---------------
Radio/Internet Interviews
Brian Sussman, was this morning’s guest on the Tea Party Power Hour radio show. Brian discussed his new book Climategate: A Veteran Meteorologist Exposes The Global Warming Scam. Most intriguing was his discussion of how man-made global warming fits into the Marxist/Socialist/Communist agenda. To listen to the interview, please click on this link.
Steve Goreham, the author of Climatism: Science, Common Sense, and the 21st Century’s Hottest Topic, Recently joined us to discuss his new position as the head of the Climate Science Association of America. Goreham says his new association will try to take the politics out of climate science. To listen to the interview, please click on this link.
Is Cap and Trade dead in the United States? It may not matter as the Environmental Protection Agency prepares to regulate CO2 and other greenhouse gases as pollution. Shannon Goessling of the Southeastern Legal Foundation discusses her organization’s four lawsuits against the EPA here.